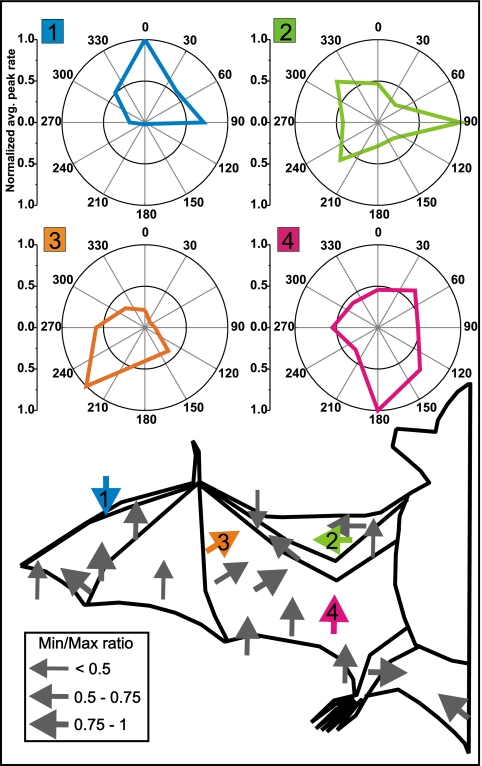
Fig. 3.
Directionality of responses to airflow in primary somatosensory cortex of Eptesicus fuscus. Top shows the directional responses of four multineuron clusters as polar plots. Airflow from each of the eight directions (every 45 °) was presented 20 times. The polar plots show the averages of the neuronal peak response, normalized to the peak. (Lower) Locations of the center of the receptive field (tip of arrow) for all tested neurons (n = 20). The arrows point in the direction of airflow that excites the neurons most at each location. The four colored arrows indicate the wing locations for the neuronal responses (Upper). Arrow thickness indicates the minimum–maximum ratio of the directional response strength. For example, a value of 0.5 indicates that for the nonpreferred direction the neuronal response was reduced by half compared with the preferred direction. Note that most neuronal clusters are tuned strongly with ratios between 0.5 and 1.

