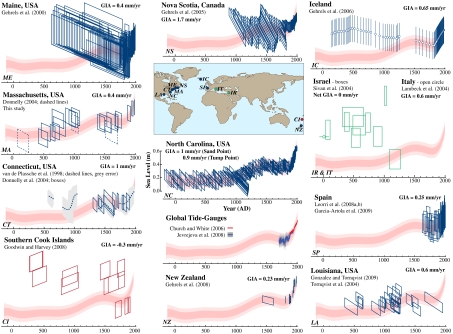
Fig. 3.
Late Holocene sea-level reconstructions after correction for GIA. Rate applied (listed) was taken from the original publication when possible. In Israel, land and ocean basin subsidence had a net effect of zero (26). Reconstructions from salt marshes are shown in blue; archaeological data in green; and coral microatolls in red. Tide-gauge data expressed relative to AD 1950–2000 average, error from (32) in gray. Vertical and horizontal scales for all datasets are the same, and are shown for North Carolina. Datasets were vertically aligned for comparison with the summarized North Carolina reconstruction (pink).

