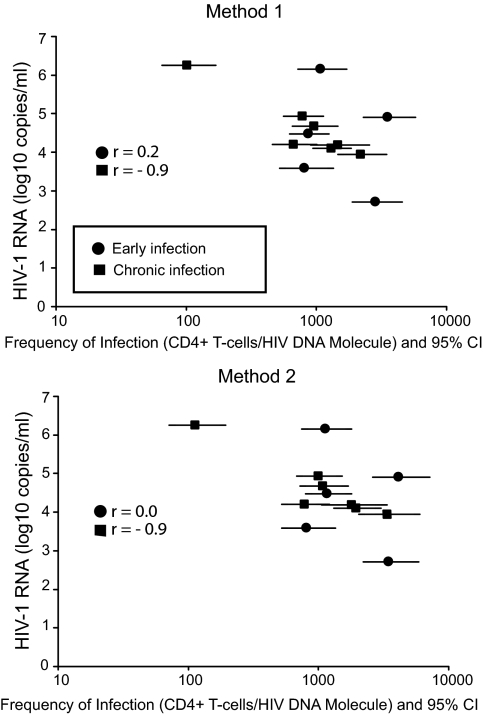
Fig. 2.
Frequency of infection of CD4+ T cells from peripheral blood in early (n = 5) and chronic infection (n = 4) vs. plasma viral RNA level. Frequency of infection for each patient and time point was calculated using two methods. The first method assumed that each observed HIV-1 amplicon represented a unique infected cell, corresponding to an assumption that no multiple infection was present. The second method assumed that any row with multiple proviruses represented only one infected cell, corresponding to an assumption that the maximum possible rate of multiple infection was present. Frequency of infection is shown as total CD4+ T cells per HIV DNA molecule. The frequency of infection with 95% confidence interval in early and chronic infection was compared, as well as the correlation between frequency of infection and plasma viral RNA levels within the two groups. The correlation analysis is represented as Spearman r values in the figure.

