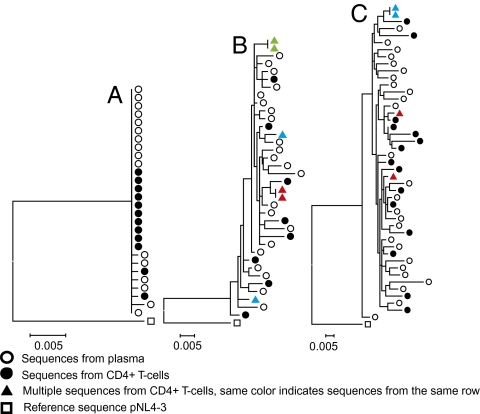
Fig. 3.
Phylogenetic analysis of viral sequences from cells and plasma. Maximum likelihood trees of plasma (open circles) and cell-derived sequences (filled circles) from early HIV infection (patient 2) (A), chronic HIV infection (patient 7, time point 1) (B), and patient 9, the longest-infected patient (C). All trees are rooted to pNL43 (open square). Colored triangles denote sequences from different wells in the same row.

