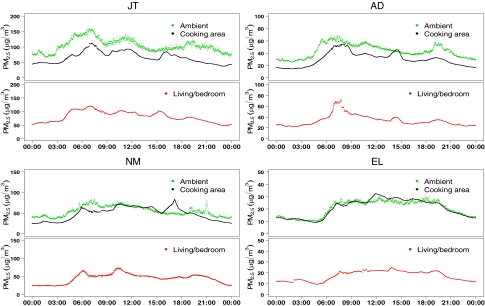
Fig. 3.
Continuous PM2.5 concentrations in the household cooking and living areas and at ambient rooftop sites. The measurements were standardized for variation in relative humidity throughout the day, corrected against gravimetric measurements and smoothed as described in SI Text. In each panel, measurements from all days over the measurement period are averaged.

