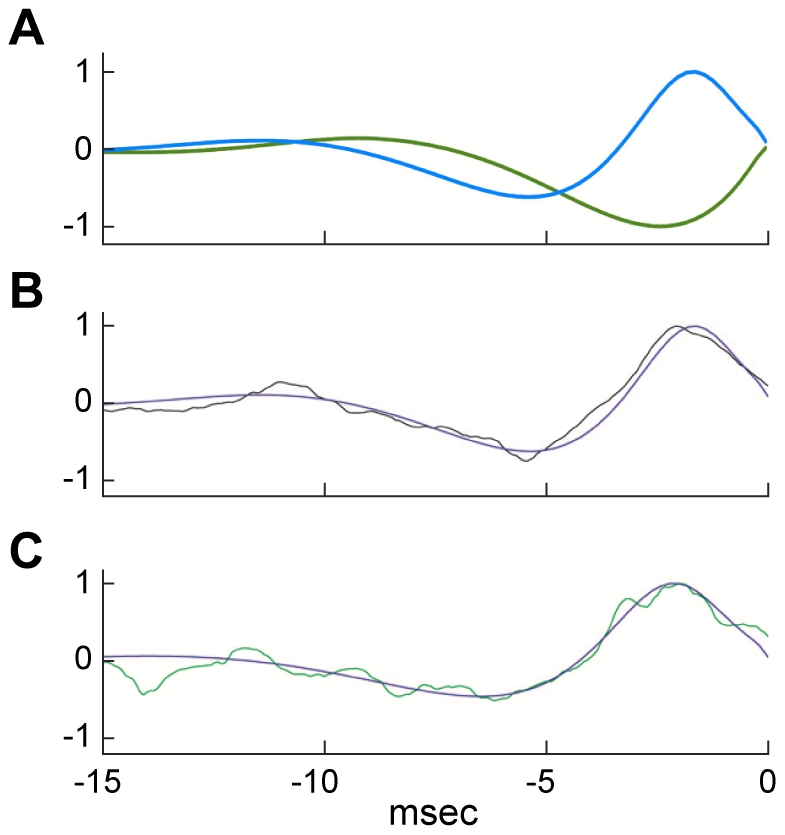
Figure 5. Comparison of optimal signals obtained from calculus of variation and noise analysis.

A) Calculus of variation waveforms determined from an optimization of the V, m, n, and h values at the end of the depolarizing (blue curve) and hyperpolarizing (green curve) pulses used to elicit a spike in the Hodgkin & Huxley model (Figure 2B & C, respectively) as described in the text (Results and Methods). These results were normalized relative to the maximum value of the blue curve. The RMS current of the blue curve is 38% less than that of the green curve. B) Overlap of the blue curve in A with the optimal noise trace obtained from the analysis of Figure 3. C) Comparison of another one of the results from Figure 4 with the optimal calculus of variations stimulus determined from a revised version of the Hodgkin & Huxley equations [14].
