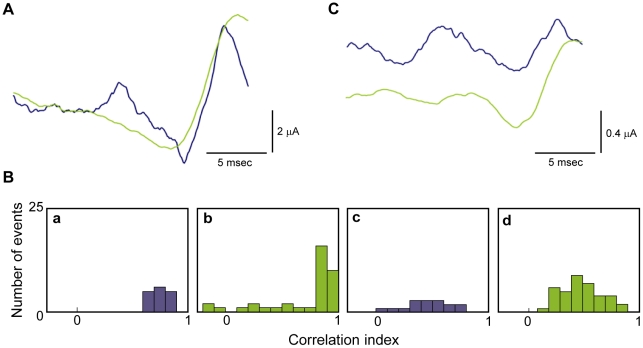
Figure 7. Effects of PSC duration on optimality.
A) We repeated the experiments carried out in Figure 3 to determine the optimal shape for eliciting an action potential with PSCs having either a long (20 msec) decay constant (green curve) or short (1 msec) decay constant (blue curve). These signals are particularly different 5 to 10 msec prior to the action potential. During this region, short PSCs excite the neuron, whereas long PSCs inhibit the neuron. B) Correlation analysis of the short versus long PSC results as described in the text. C) The intracellular pH of the axon was elevated to increase axon excitability (15) and the experiments in A were repeated. For the axon with enhanced excitability, the difference between the optimal signals comprised of short PSCs and those comprised of long PSCs was more pronounced.

