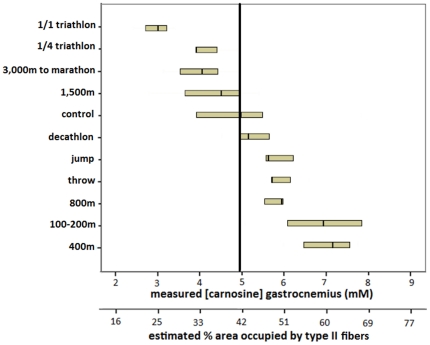
Figure 3. Carnosine content of gastrocnemius muscle in track-and field and triathletes compared to an untrained male control population.
Muscle carnosine content (mM) in various small groups of male elite athletes (n = 39) and in a male control population (n = 47) ranked from low to high. Numbers per group are demonstrated in figure 1. The primary X-axis shows the measured carnosine content, while the secondary X-axis displays the estimated percentage area occupied by type II fibers (derived from figure 2). The vertical line represents the median of the male control population. Medians (small vertical lines) and first and third quartile are shown by group.

