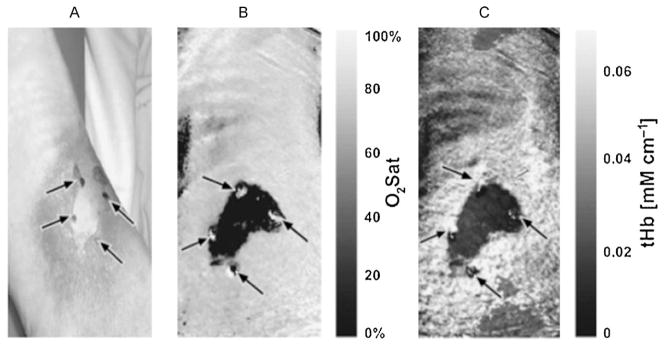
Fig. 2.
Near-infrared spectral imaging. (A) Digital photograph of burn wound to the leg with central area of full thickness. (B) Map of tissue oxygen saturation with darker areas representing less oxygenation, corresponding to full thickness injury. (C) Map of total hemoglobin concentration with darker areas representing less hemoglobin. (Reprinted from Ref. [40]. Copyright 2007 by John Wiley and Sons. Reprinted with permission.)

