Fig 2.

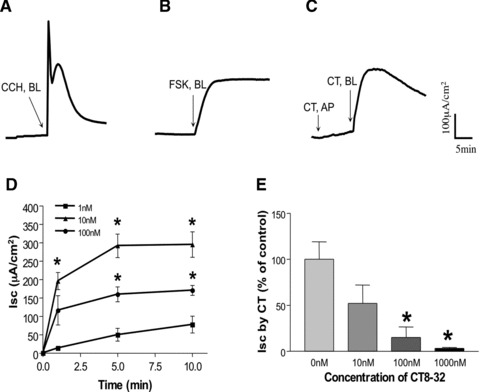
CT-induced ISC in T84 monolayers. A representative tracing is shown here: (A) CCH (100 μM), (B) FSK (10 μM) when added from the basolateral side of the T84 cell monolayer after the baseline was established. In (C), CT (10 nM) was initially added from the apical compartment (AP), then at the basolateral side (BL) of the T84 monolayer. (D) Dose–response. CT was added from the basolateral side of the T84 cell monolayer after the baseline was established at different concentrations: 1, 10 and 100 nM. Values represent the mean ± S.E. of three independent determinations. *P < 0.001 compared to cell treated with 1 nM. (E) T84 cell monolayer was pre-incubated with CT antagonist, CT8–32 at different concentrations for 20 min. from the basolateral side, then CT (10 nM) was added also from the basolateral side for 10 min. Values shown here are the percentage of control (i.e. without CT8–32) and represent the mean ± S.E. of three independent determinations. *P < 0.001.
