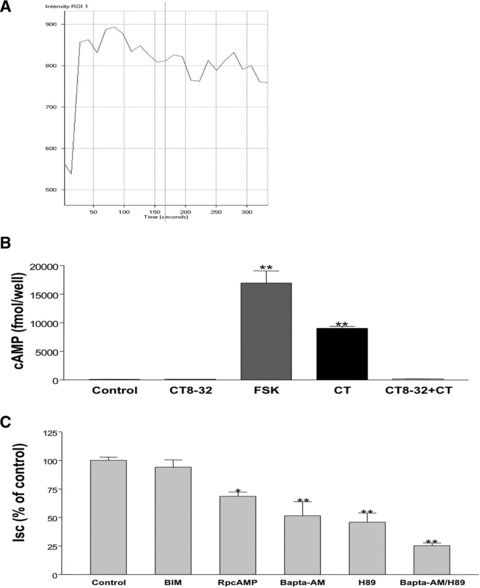
Fig 4.

CT-induced Cl− secretion involves Ca2+- and PKA- dependent pathways. (A) Live calcium imaging study was used to detect intracellular Ca2+ signal after adding 10 nM of CT to the basolateral side according to manufacturer’s protocol (y-axis represent the intensity of the signal indicating the level of intracellular Ca2+) (B) Intracellular cAMP was measured according to manufacturer’s protocol 10 min. after basolateral addition of control (vehicle), CT8–32 (1000 nM), FSK (10 μM), CT (10 nM) or CT (10 nM) with 30 min. of pre-incubation of CT8–32 (1000 nM). (C) CT (10 nM) was added from basolateral side 45 min. after incubation with control = vehicle, BIM (5 μM), RpcAMP (25 μM), BAPTA-AM (20 μM), H89 (10 μM) or BAPTA-AM (20 μM) combined with H89 (10 μM) from both apical and basolateral sides. Data were calculated as percentage of control obtained from 10 min. after adding CT. Results represent mean ± S.E.M. of five or more independent experiments in all above figures. *P < 0.01, **P < 0.001.
