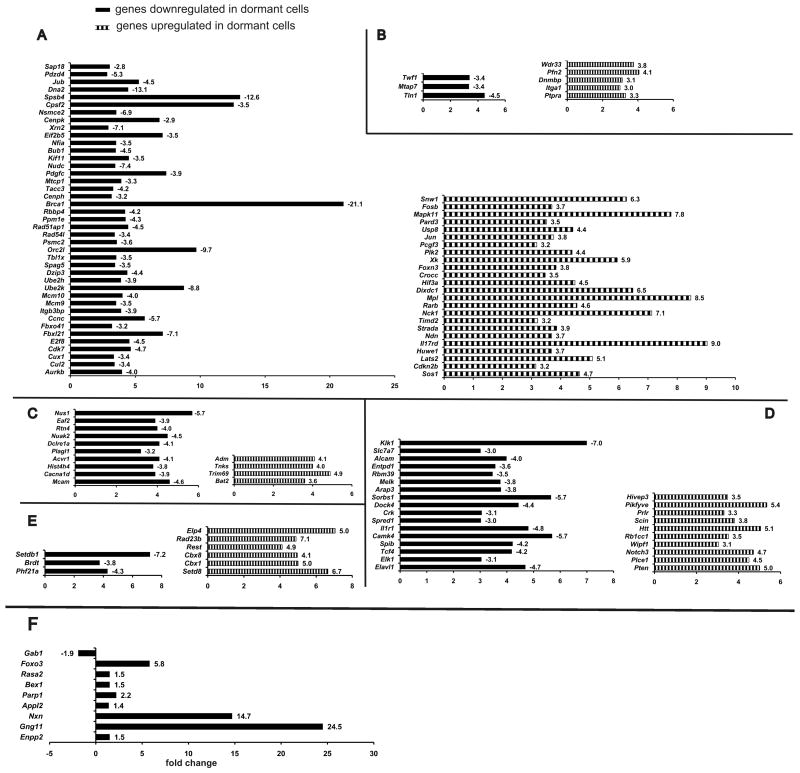
Figure 7.
Gene expression and RT-PCR validation in quiescent memory CD4+ T cells by cRNA gene chip microarray. CD4+ KJ1.26+ T cells were extracted from spleens of 5 mice from each group (proliferation data shown in Supplementary Fig. 2) were pooled together, flow-sorted and their mRNA was isolated for determination of their global gene expression by cRNA microarray. Raw Affymetrix gene microarray expression data were statistically processed as described in Methods Section and filtered by signal strength. The resulting lists of up- and downregulated genes and functional clustering analysis performed by DAVID database software. (A) Proliferation and cell cycle, (B) Cytoskeletal rearrangement, (C) Apoptosis and cell survival, (D) Immune activation and suppression, (E) Chromatin remodeling. Line bars represent changes in gene expression in long-term memory CD4+ T cells, obtained by cell sorting from mice in dormant (CpG) group vs. non-dormant (CFA) group. F. Values for mRNA expression are normalized to four housekeeping genes. Fold differences in mRNA expression are shown as bars. mRNA expression pattern confirms the notion of oxidative stress in long-lived dormant memory CD4+ T cells and activation of protective mechanisms.

