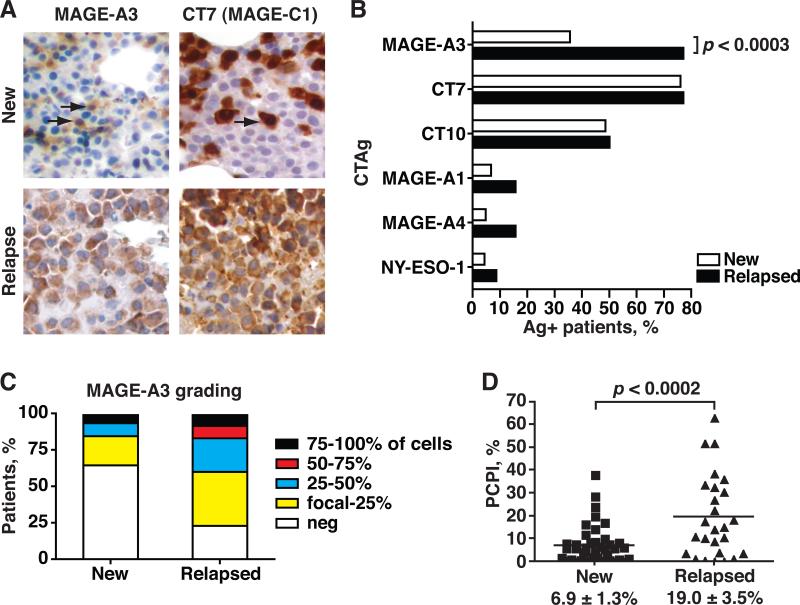
Figure 1. Immunohistochemical analysis of CTAg expression in newly diagnosed and relapsed myeloma patients.
A. Bone marrow biopsy sections were stained with a panel of mAb recognizing several CTAg (MAGE-A3 and CT7 shown). Representative sections are depicted. Brown chromophore indicates positive staining for CTAg (arrows). 20X magnification. B. Frequency of expression for each CTAg in new and relapsed patients were plotted and compared. C. Grading of MAGE-A3 expression (percent of MAGE-A3+ MM cells) was divided into quartiles (focal-25%, 25-50%, 50-74%, and 75-100%) and plotted by the percentage of patients in each quartile. D. Plasma Cell Proliferation Index was plotted for newly diagnosed and relapsed MM patient specimens. Mean PCPI ± standard error of the mean depicted. P-values calculated by Student's two-tailed t-test.

