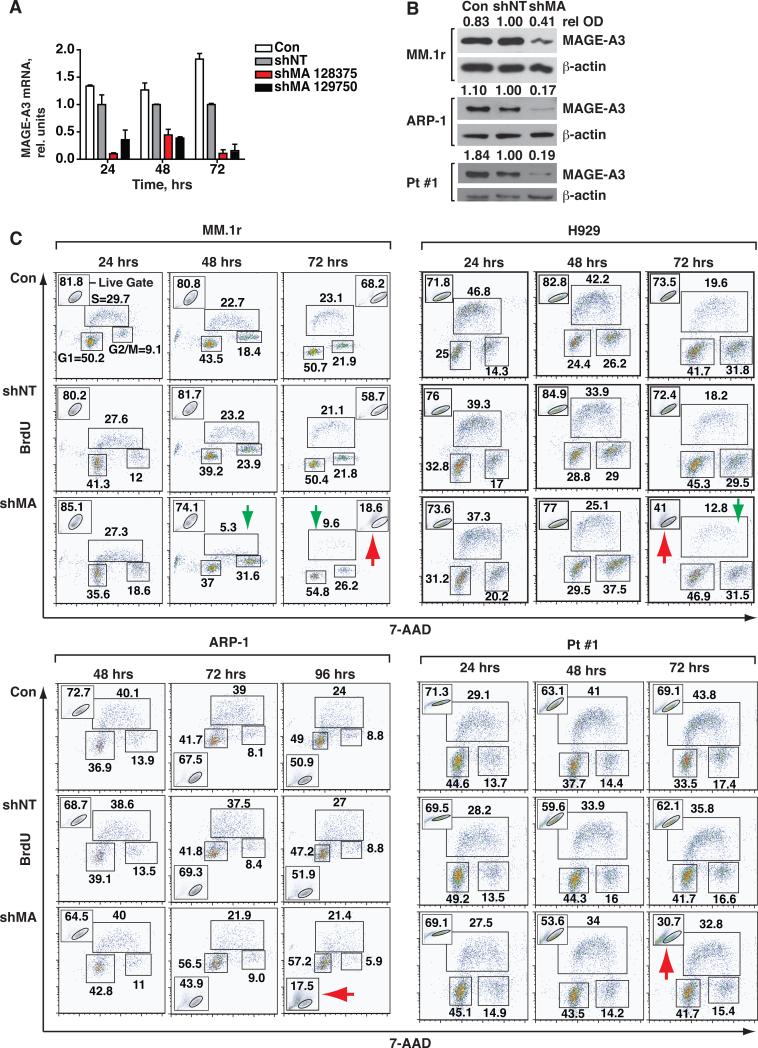
Figure 2. Silencing of MAGE-A does not directly affect proliferation in MM cells.
MM.1r and ARP-1 HMCL and Pt #1 cells were transduced with MAGE-A-targeted (shMA 128375 and 129750) or non-target (shNT) shRNA lentiviral particles and samples were harvested at the indicated time points. A. MAGE-A3 mRNA in MM.1r cells was assessed by semi-quantitative real time (q) RT-PCR. Results were normalized to shNT control at each time point. Error bars depict standard error of the mean for triplicates of each sample. Control (Con), untreated negative control cells. B. HMCL and Pt #1 cells were treated with shMA 128375 or controls and MAGE-A3 protein expression was assessed by western blot at 48 hrs. Relative optical density (rel OD) was normalized to matched β-actin and expressed as a fraction of shNT control. C. shMA-transduced and control cells were pulsed for 30 minutes with 10 mM BrdU at the indicated time points. Proliferation was assessed by intracellular staining for BrdU and 7-AAD, followed by flow cytometry. Acquisition populations were gated on viable cells in forward vs. side scatter plots (Live Gate, insets) and the gated events plotted by 7-AAD (total DNA content) vs. FITC (BrdU incorporation) fluorescence, resulting in segregation into the G1, S, and G2/M populations as labeled in the first panel.

