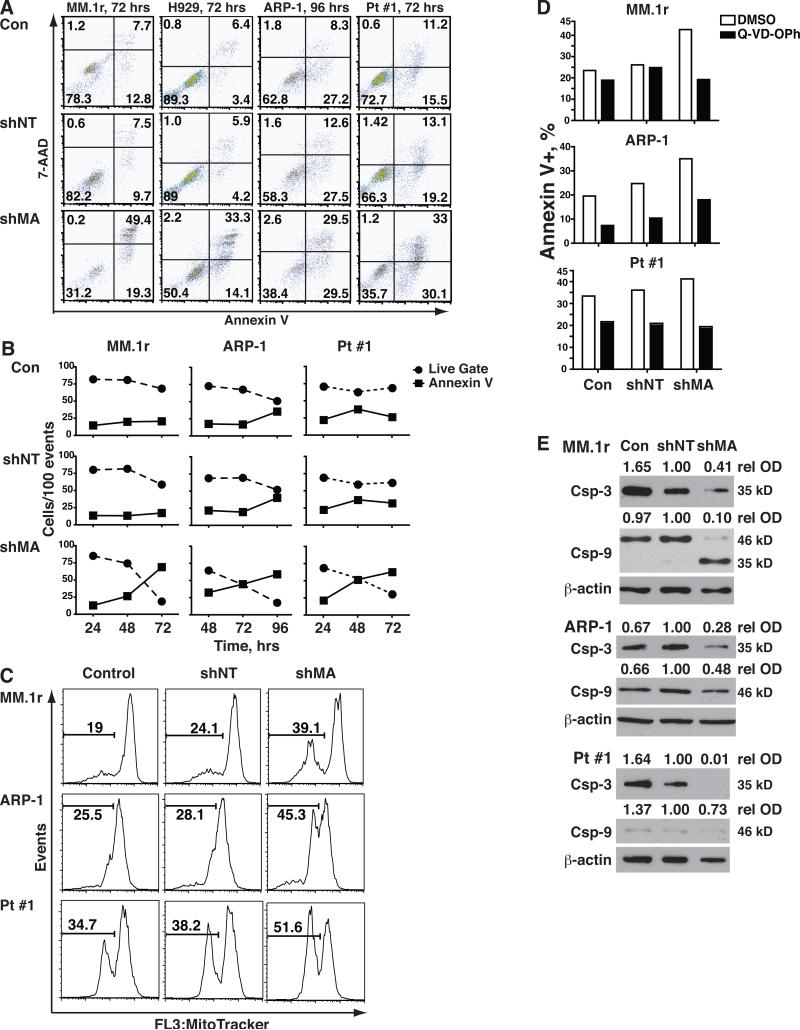
Figure 3. Silencing of MAGE-A results in activation of intrinsic apoptosis.
HMCL and Pt #1 cells were transduced shMA or controls as previously described and apoptosis was assessed by staining with annexin V. A. Total (ungated) acquisition populations at 72 or 96 hrs were plotted by Annexin V-PE (apoptosis) vs. 7-AAD (necrosis) fluorescence. B. The percentages of viable cells (Live Gate as described in fig. 2, solid circles) and annexin V+ cells in the ungated acquisition population (solid squares) were plotted over time for the MAGE-A-silenced and control groups. C. HMCL and Pt#1 cells were stained with MitoTracker Red®, which is fixed in mitochondria with intact membrane polarization, and analyzed by flow cytometry. Total (ungated) events were plotted by MitoTracker Red® fluorescence and mitochondrial depolarization was assessed by decreased fluorescence (bars). E. Lentivirus-transduced cells were incubated with 10 μM Q-VD-OPh or DMSO vehicle control for 72 hrs and apoptosis was assessed by staining with annexin V. D. Caspase-3 and -9 were analyzed by western blot in at 48 hrs for MM.1r and Pt #1 and 72 hrs for ARP-1 cells.

