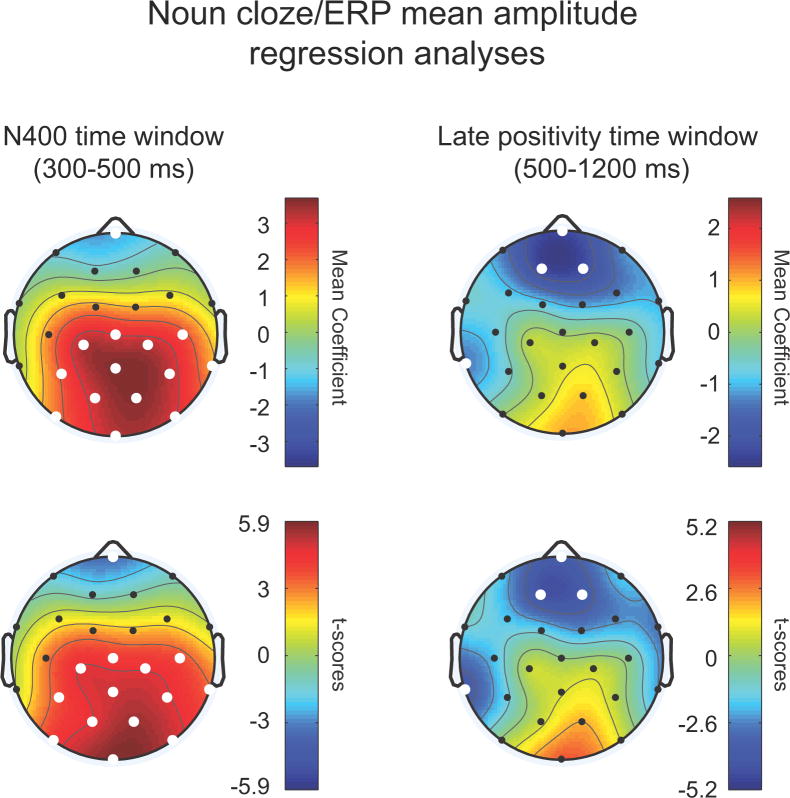
Figure 2.
Scalp topographies of noun ERP mean amplitude/cloze probability correlations from repeated measures regression analyses. Redder shading indicates more negative ERP responses with decreasing cloze, and bluer shading indicates increasing ERP positivity with decreasing cloze. The upper topography maps plot slope coefficients at each channel, and the bottom maps visualize the regression coefficients as t-scores (i.e., the mean coefficient divided by the standard error of the mean) to give a sense of how reliably the coefficients differ from zero across participants. The p-values of significant correlations (indicated by white electrodes) range from 1e-6 ≤ p ≤ .019 (300–500 ms) and from .003 ≤ p ≤ .013 (500–1200 ms).

