
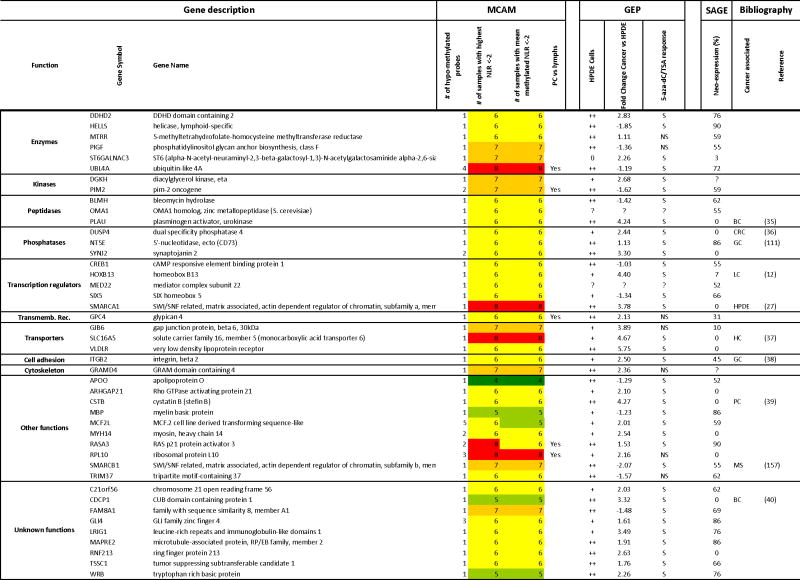
Table 2.
List of hypomethylated and upregulated candidate genes.
|
MCAM: Methylated CpG island Amplification strategy coupled with Microarray platform. PC: Pancreatic Cancer; Lymphs: lymphocytes.
GEP: Gene Expression Profiling with Affymetrix Exon Arrays. The HPDE column indicates the level of expression of the gene in normal cells (0: virtually undetectable signal; +: weak expression; ++ strong expression).
In the 5-aza-dC/TSA column, S indicates a significant response to treatment and NS indicates a not significant response based on a Two-way ANOVA analysis between 5-aza-dC– and/or TSA-treated and untreated cancer or non cancer cells and a P value of <0.05.
SAGE (Serial Analysis of Gene Expression): The numbers indicate the % of pancreatic cancer samples in which the normalized number of tags was >10 while the number of tags in normal samples was <1 (1).
Bibliography: Reference numbers refer to the supplemental list of references in the supplemental materials.
PC: Pancreatic Cancer; HPDE: human pancreatic ductal epithelial cells; CRC: Colorectal Carcinomas; BC: Breast Cancer; GC: Gastric Cancer; LC: Lung Cancer;
HC: hepatocellular carcinoma; MS: Myelodysplastic Syndrome
Color coding:
 4 samples with lowest signal ratio >2 or with mean Normalized Log Ratio > 2