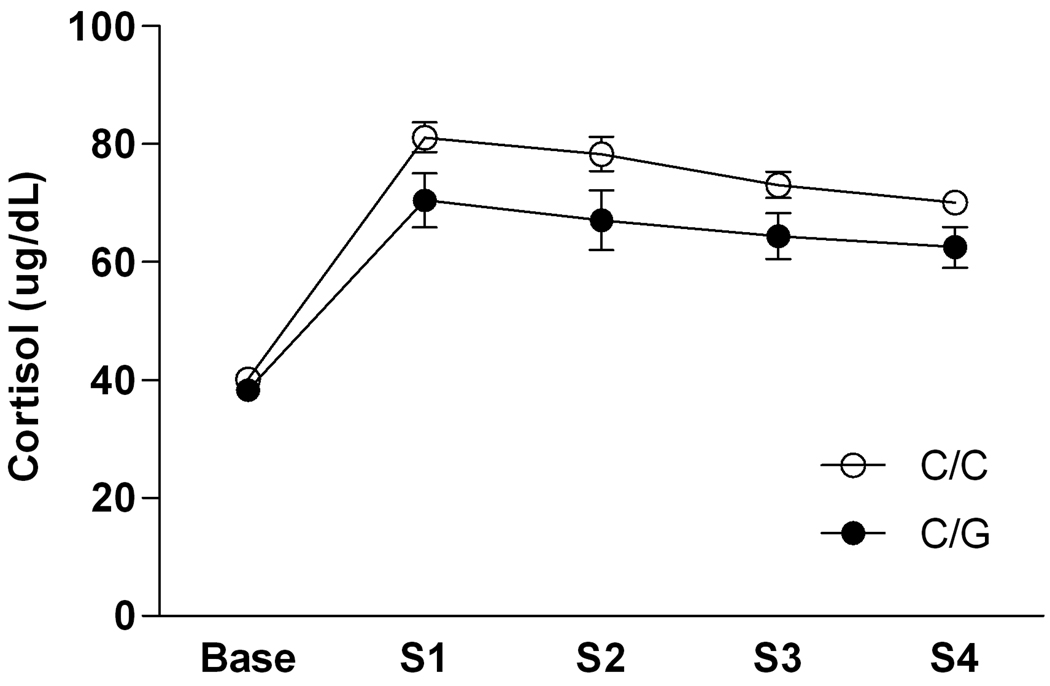
Figure 1.
Peak cortisol response to maternal separation as a function of OPRM1 genotype in six month old rhesus macaque infants. Values are given as mean ± SEM. Peak cortisol responses were determined by comparing values at hour 1 and hour 2 of separation on the Monday of each separation week, When data were analyzed using only the hour 2 values for all subjects (the time point for which most subjects exhibited the peak response), the results were the same. S1 = week 1 separation, S2 = week 2 separation, S3 = week 3 separation, S4 = week 4 separation.

