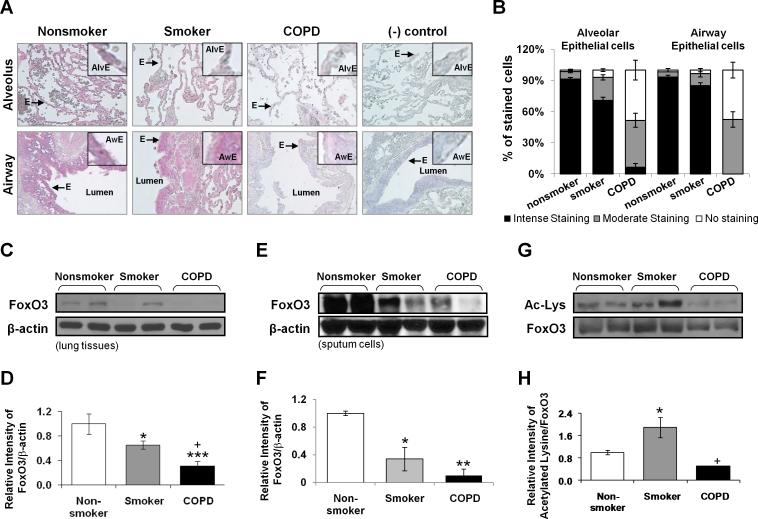
FIGURE 1. FoxO3 is down-regulated in lungs of smokers and patients with COPD.
A, Abundance and localization of FoxO3 in lung alveolar/airway epithelial cells of nonsmokers, smokers and patients with COPD. Red color represents the presence of FoxO3 (indicated with arrow), which was decreased in lungs of smokers and patients with COPD. (-) control = negative control which was stained without primary antibody Alv = alveoli; Aw = airway; E = epithelial cells. Original magnification, × 200. B, Immunostaining scores for FoxO3 per cell-type in alveolar and airway regions of the lung. The assessment of immunostaining intensity was performed semiquantitatively and in a blinded fashion. Immunoblot analysis of FoxO3 in whole tissue lysates extracted from the lung tissue (C) and sputum cells (E) of nonsmokers, smokers, and patients with COPD. After densitometric analysis, the values of FoxO3 in lung tissue (D) and sputum cells (F) were normalized against β-actin (loading control). The relative levels of FoxO3 were significantly decreased in lung tissues of smokers and patients with COPD compared to nonsmokers. G, Whole tissue lysates extracted from the lung tissues of nonsmokers, smokers, and patients with COPD were immunoprecipitated with anti-FoxO3 antibody, and immunoprecipitates were subjected to immunoblot and probed with anti-acetylated lysine antibody. H, Relative intensity of acetylated lysine/FoxO3 represents the increased acetylation of FoxO3 in lungs of smokers. Data are shown as mean ± SEM (n= 3 to 4 per group). *P < 0.05, **P < 0.01, ***P < 0.001, significant compared to nonsmokers. +P < 0.05, significant compared with smokers.

