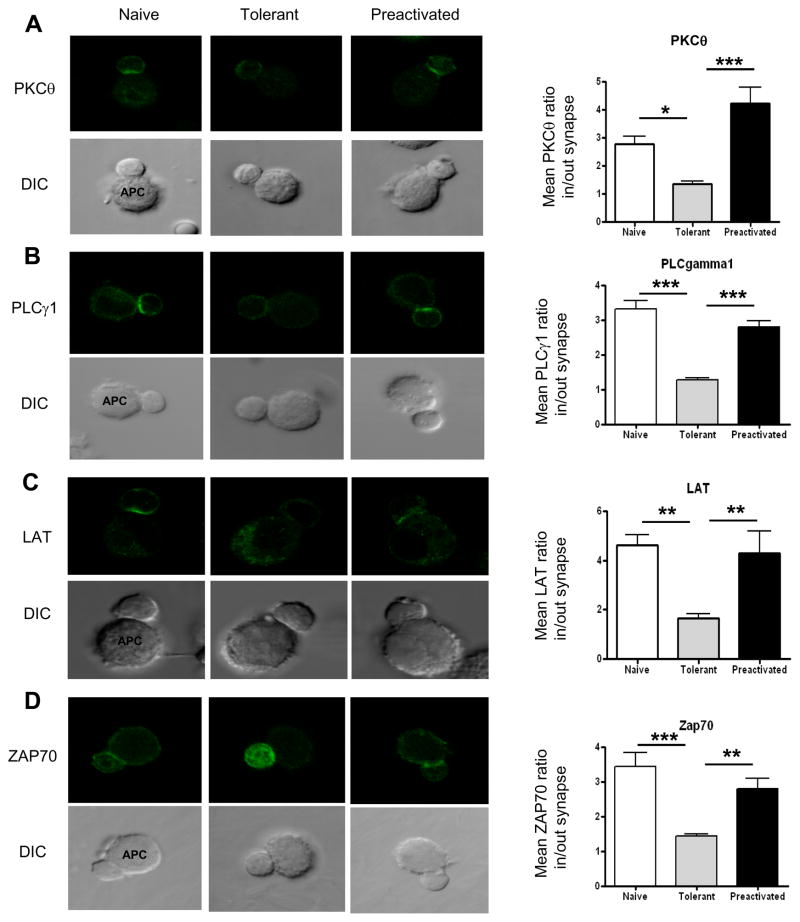
Figure 4. Translocation of signaling molecules to the T cell/APC contact region is greatly impaired in adaptively tolerant T cells.
A, B, C, and D, Purified naïve, adaptively tolerant or pre-activated T cells were stimulated for 5 min with the P13.9 cell line pre-pulsed with 1μM MCC (88–103). Cells were fixed, permeabilized, and stained for PKCθ, PLCγ1, LAT, or ZAP70. Representative images for T cell/APC conjugates and the localization of PLCγ1, LAT, or ZAP70 are shown in the left panels. The localization of PLCγ1, LAT, or ZAP70 was measured with ImageJ software (http://rsb.info.nih.gov/ij/). The means ± SEM of the inside to outside distribution of staining at the synapse for A) PKCθ, B) PLCγ1, C) LAT or D) ZAP70 are shown in the right panels. Twenty five conjugates were counted in each of 2 experiments. *, p < 0.05; **, p < 0.01; ***, p < 0.001.

