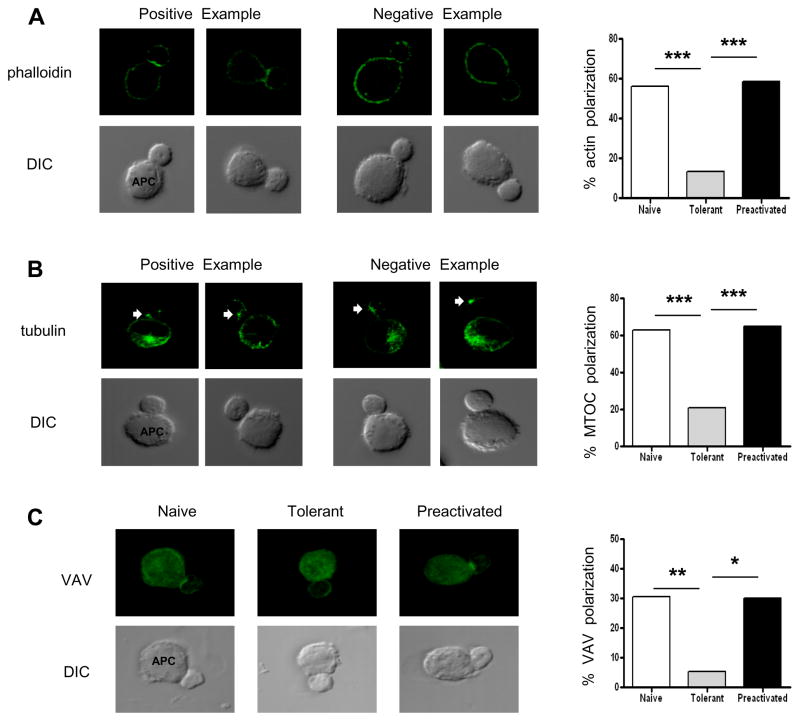
Figure 7. Actin polymerization at the immune synapse, MTOC polarization toward the synapse, and translocation of VAV to the contact site in adaptively tolerant T cells.
A and B, Purified T cells were conjugated for 20 min with the P13.9 cell line pre-pulsed with 1μM MCC (88–103). Cells were fixed, permeabilized, and stained with Alexa488- phalloidin to visualize F-actin (A) or anti-tubulin to visualize the MTOC (B). Representative images are shown in the left panels for Tcell/APC conjugates revealing the enhancement of F-actin at the immune synapse or the MTOC localized to the proximal third of the T cell facing the synapse. The quantitation of the number of cells in which the F-actin localized to the synapse or of conjugates showing the MTOC localized to the proximal third of the T cell are summarized in the right panels for 2 experiments of 25 and 50 conjugates examined. ***, p < 0.0001 by Chi square analysis.
C, Purified naïve, adaptively tolerant or pre-activated T cells were stimulated for 20 min with the P13.9 cell line pre-pulsed with 1μM MCC(88–103). Cells were fixed, permeabilized, and stained for VAV. Representative images for Tcell/APC conjugates and the localization of VAV are shown in the left panels. The quantitation of the number of cells in which VAV localized to the synapse is summarized in the right panel for 2 experiments of 25 and 30 conjugates examined. *, p < 0.001; **, p < 0.0005 by Chi square analysis.

