Fig. 6.
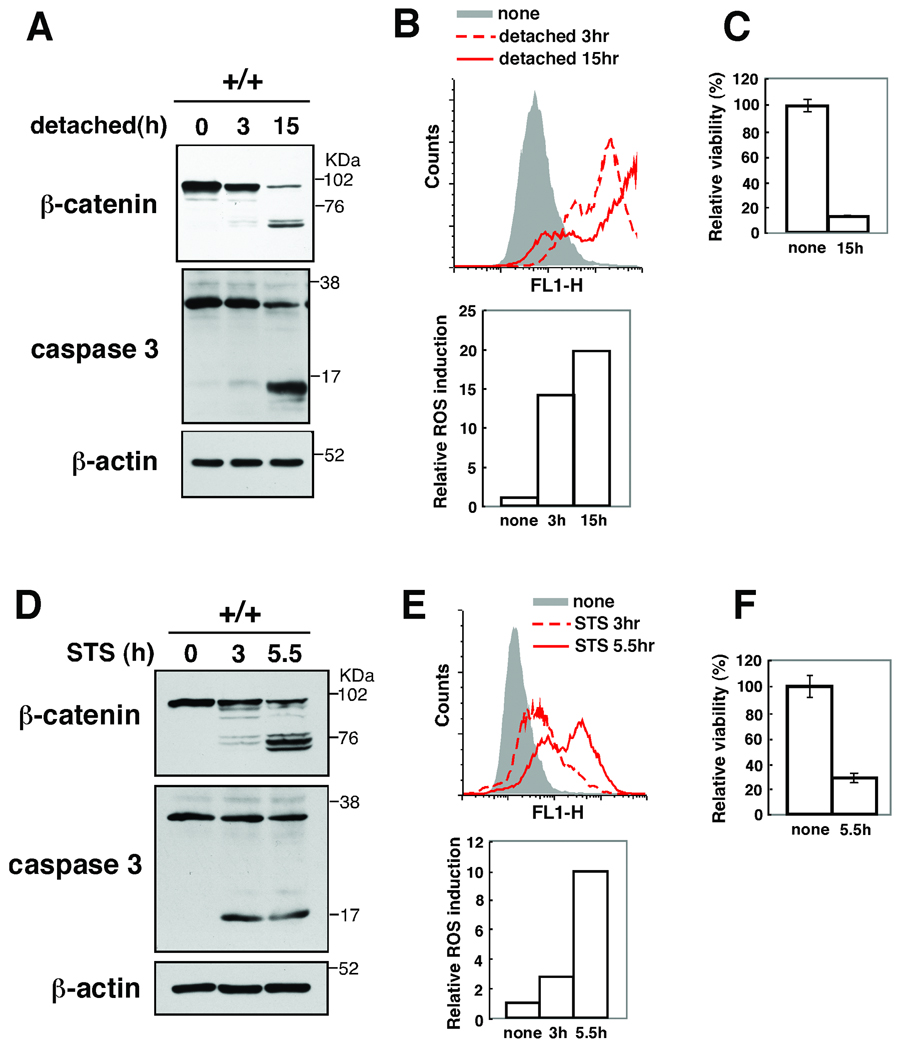
(A–C) tak1 +/+ keratinocytes were trypsinized and cultured in calcium free media for 3 or 15 h. Cell lysates were immunoblotted with anti-β-catenin and anti-caspase 3 (A). Cells were incubated with 10 µM CM-H2DCFDA for 30 min and analyzed by flow cytometry (B). The fluorescence units relative to that of unstimulated cells are also shown (A, bottom). Cell viability was measured by MTT assay. Data are the mean±S.E. of three samples (C).
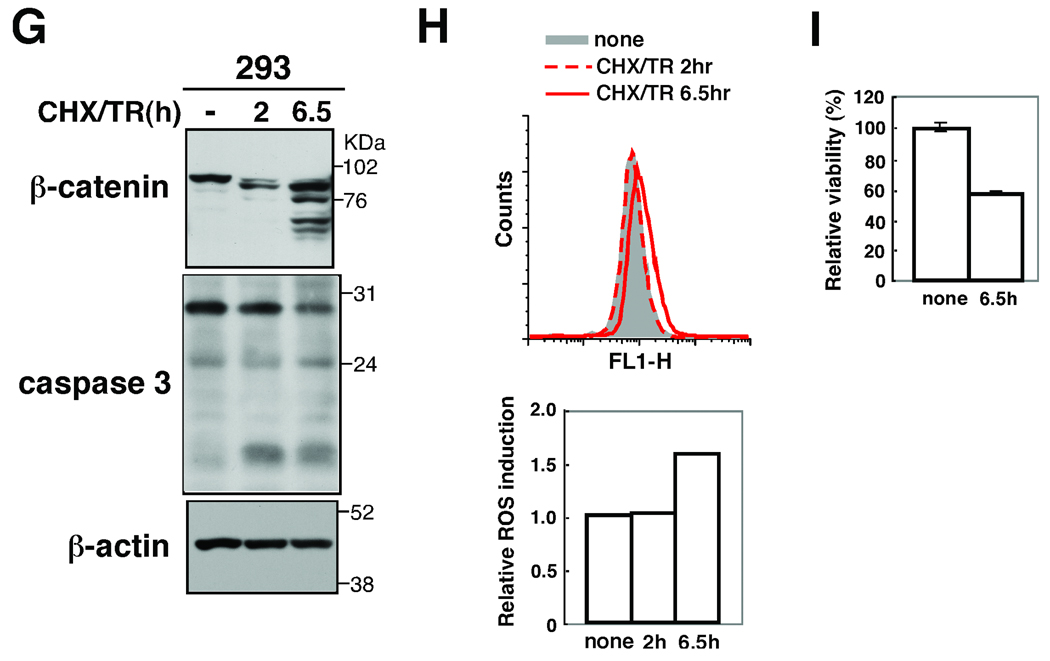
(D–F) tak1 +/+ keratinocytes were stimulated with 0.5 µM staurosporine (STS) for 3 or 5.5 h. Cells were analyzed as described above. (G–I) HEK293 cells were prestimulated with 100 µg/ml cycloheximide (CHX) for 1 h and stimulated with 100 ng/ml TRAIL (TR) for 2 or 6.5 h. Cells were analyzed as described above.


