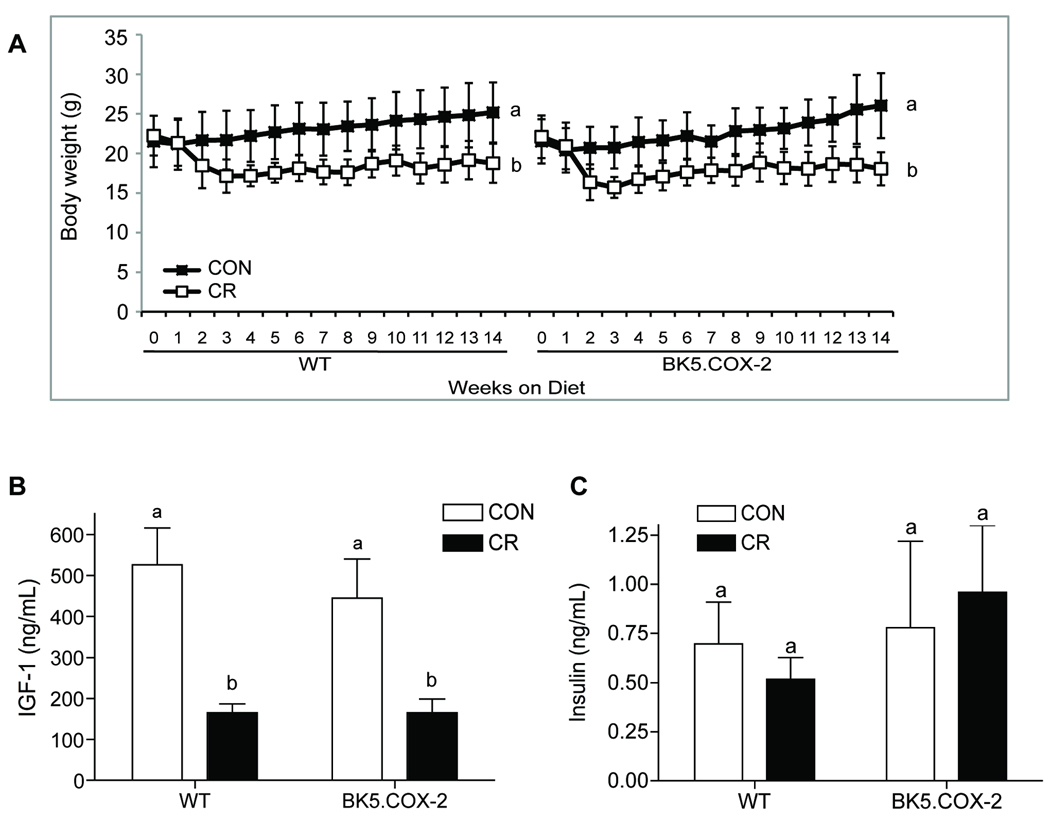
Figure 1.
Effect of diet on body weight, IGF-1, and insulin serum levels in WT and BK5.COX-2 mice. A, weekly average body weights of control and CR WT mice (n=24 per diet group) and control and CR BK5.COX-2 mice (n=24 per diet group) through 14 weeks of dietary regimens. Error bars represent SD. Fasting serum IGF-1 levels (B) and insulin levels (C) at week 14 for control and CR WT mice (IGF-1, n=12 per diet group; insulin, n=10 per diet group) and control BK5.COX-2 (IGF-1, n=12 and insulin, n=10) and CR BK5.COX-2 mice (IGF-1, n=7; insulin, n=10). Differences in sample size were dictated by serum availability at the time assay was performed. Error bars represent SEM. Significant differences are denoted by different letters.

