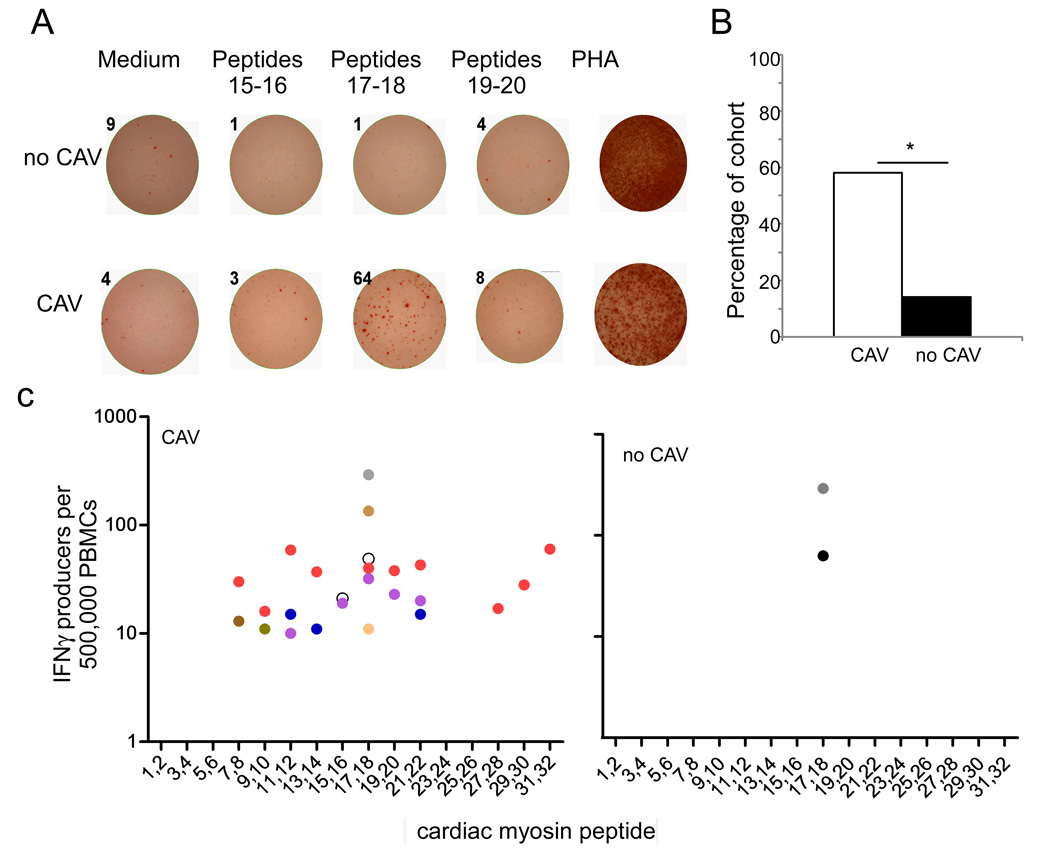
Figure 6. Stronger T cell reactivity to CM in patients with CAV.
A. Representative IFNγ ELISPOT wells in which PBMCs obtained from one patient without CAV (no CAV, top row) and one with CAV (bottom row) were stimulated with medium alone or 3 different pairs of CM-derived peptides. PHA served as a positive control. Numbers above each well are the spots detected. B. The prevalence of T cell reactivity to CM as defined by >10 IFNγ producers per 500,000 PBMCs in response to at least one peptide is shown for 18 patients with CAV and 13 patients without CAV (*p<0.05). C. Peptide mapping of PBMCs from CAV patients (left) and nCAV patients (right). Each color represents the responses of a different patient.

