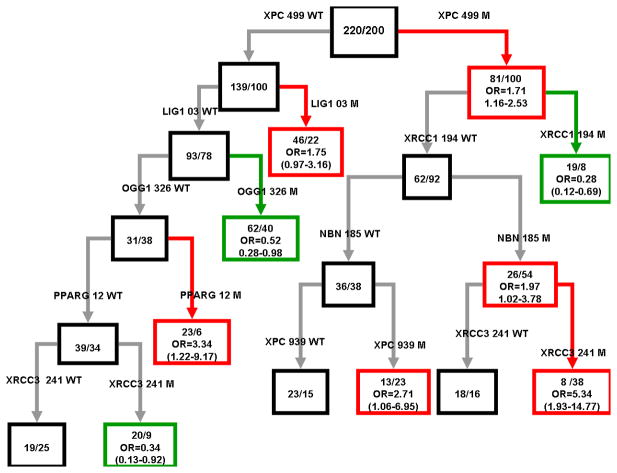
Figure 1.
Nodes of the classification tree are formed by recursive splits of HL case/control status by SNPs. Within each black node, M/N is the number of controls/number of cases. Within each red (high risk) or green (low risk) node, M/N is the number of controls/number of cases and the OR (95% CI) is the odds of HD for a node with respect to its sister black node.

