
Fig 2.
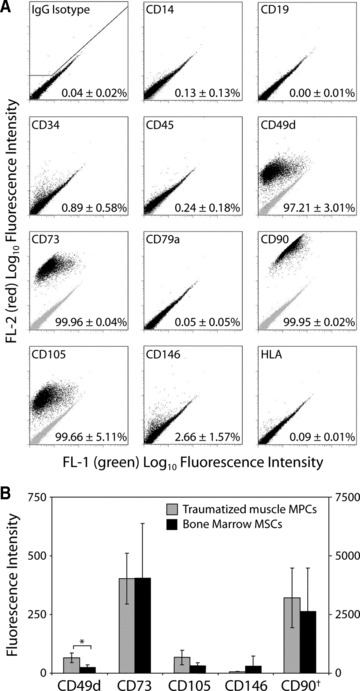
Cell surface epitope profile of traumatized muscle derived MPCs. (A) MPC cell surface marker expression (black dots) compared to isotype control (grey dots) were compared using flow cytometry. All antibodies were PE conjugated (red), and the percentage of events with elevated FL-2 fluorescence is indicated in each panel (mean ± S.D. for n= 4). (B) The fluorescence intensity of positive surface markers was compared between MPCs and bone marrow derived MSCs. *P < 0.05, Student’s t-tests with n= 4, †the fluorescence intensity of CD90 is 10× greater than the other surface markers and is depicted using the right axis.