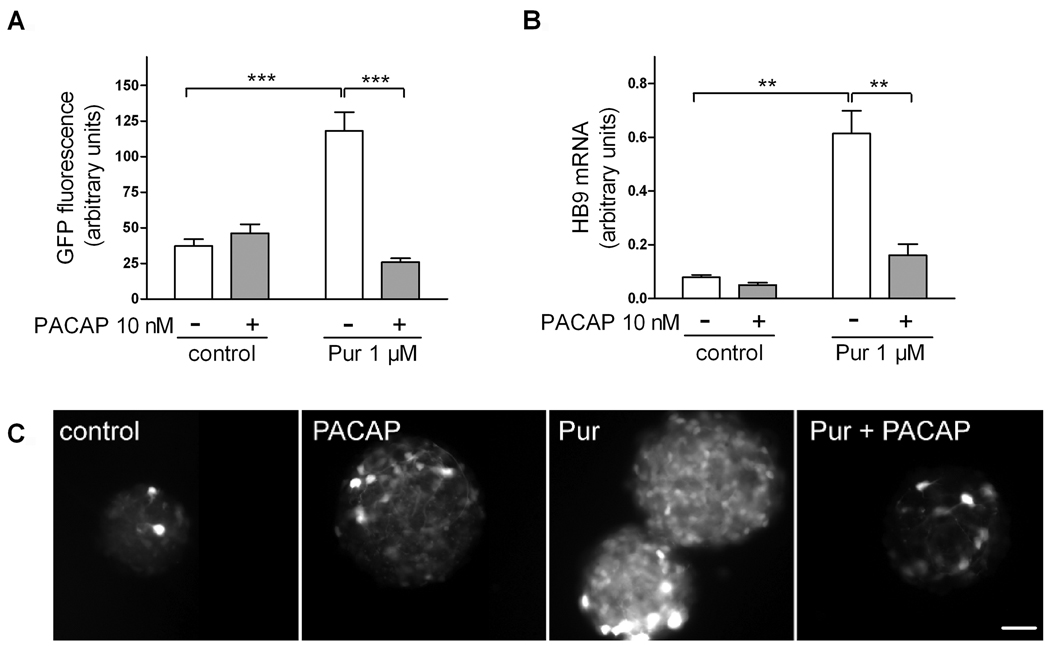
Figure 3. PACAP antagonizes the effect of purmorphamine on HB9:GFP expression in HB9::GFP embryoid bodies.
EBs were cultured for 5 days with 1 µM retinoic acid and purmorphamine (1 µM) and/or PACAP38 (10 nM). (A,C) Images of GFP fluorescence of 6–9 randomly chosen EBs were taken and average pixel intensity was calculated. Results are mean fluorescence intensity ± SEM. Representative images are shown in (C); scale bar is 100 µm. (B) qRT-PCR analysis of HB9 gene expression in EB extracts. Results are mean HB9 expression levels from 5–6 individual samples ± SEM. n/s: non-significant, *p<0.05, **p<0.01, ***p<0.001.

