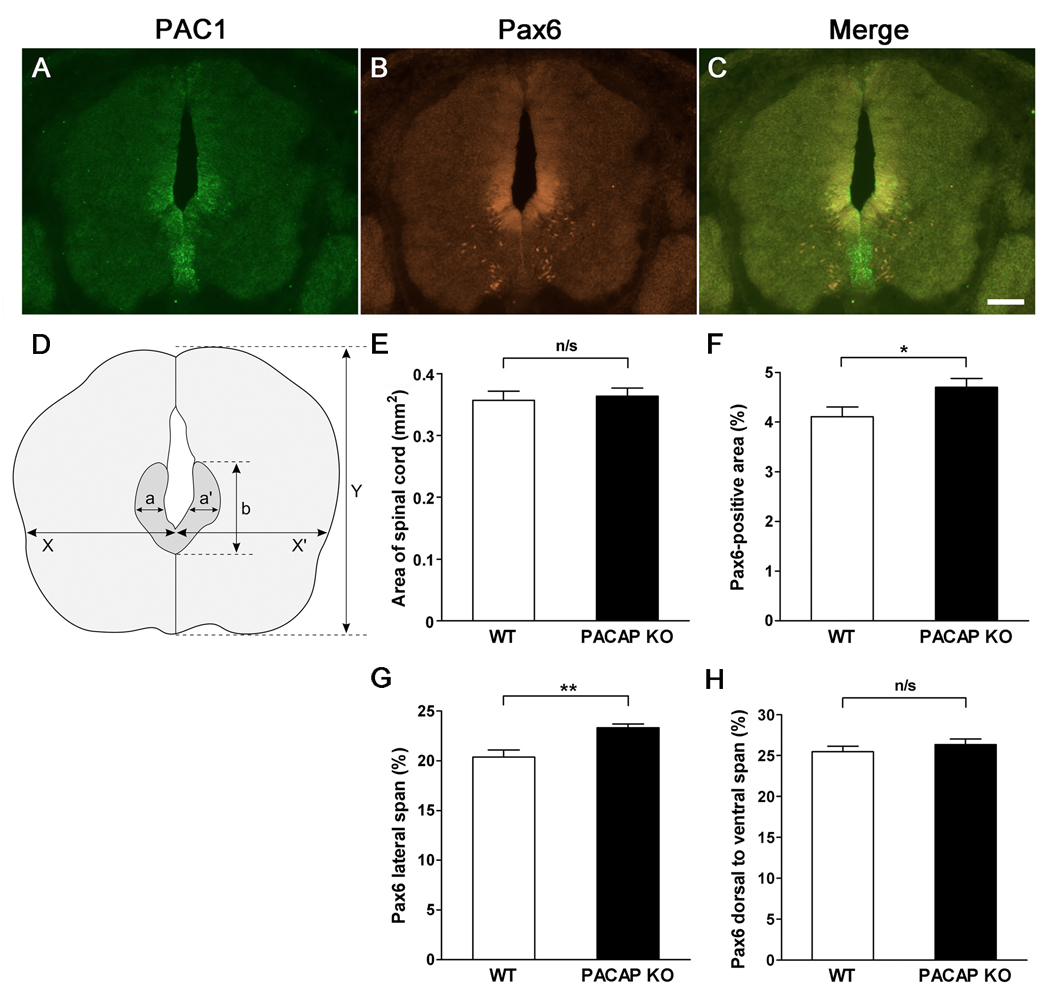
Figure 7. PACAP receptor (PAC1) gene expression in the ventricular zone (VZ) of mouse embryonic day 12.5 spinal cord, and expansion of the Pax6 domain in the dorsal portion of the basal plate VZ of PACAP-deficient mice.
(A) In Situ Hybridization with Digoxigenin-Labeled Riboprobe for PAC1. (B) Pax6 immunohistochemistry. (C) Merged image of PAC1 mRNA and Pax6 immunohistochemistry. Scale bar, 100 µm. (D) Dimensions of Pax6-positive area were measured as indicated. (E) Total spinal cord area in WT vs. PACAP KO mice. (F) Pax6-immnostained area expressed as a percentage of total area of spinal cord. (G) Lateral span of Pax6-immunostained area expressed as percentage of total spinal cord ((a+a’)/(X+X’) (%) in Fig. 7D). (H) Dorsal to ventral span of Pax6-immunostained area in spinal cord expressed as percentage of total spinal cord (b/Y (%) in Fig. 7D). n=7 for each genotype. Results expressed as mean ± SEM. n/s: non-significant, *p<0.05, **p<0.01.

