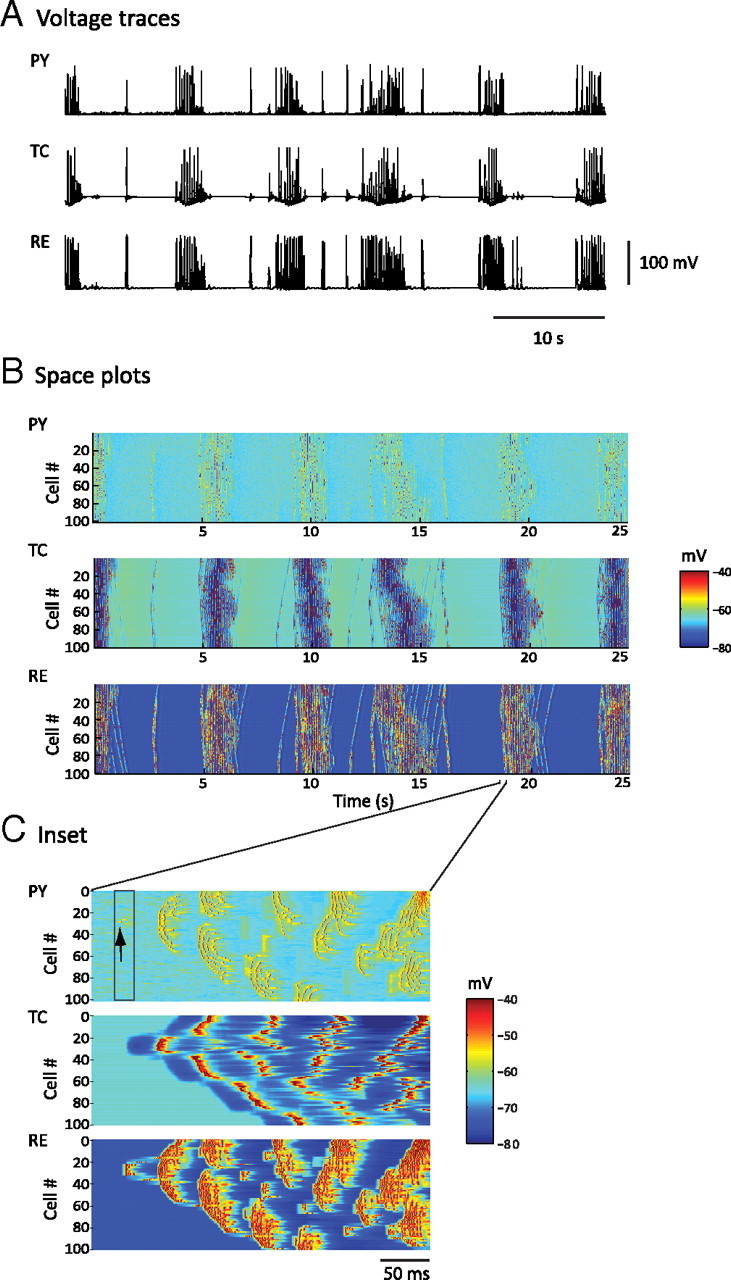
Figure 2.

Simulated spindle oscillations. A, Voltage traces of individual neurons [PY (cortical pyramidal), TC (thalamocortical), and RE (reticular thalamic)] in each layer of the thalamocortical network during a 50 s simulation of spindle activity. B, Space–time plot representing the activity of the whole network for 25 s, showing the pattern of wave propagation within the network. Individual membrane potential activity from A corresponds to the cell in the middle of each respective layer (Cell #50 of TC, RE, and PY) of B. The value of the membrane potential for each neuron is coded by the false color scale. C, Enlargement for 350 ms of the space plot in B showing a spontaneous initiation of a spindle cycle. A small subset of PY cells accounted for the genesis of the cycle (black arrow), and RE cells were then recruited. TC cells exhibited far less bursting than RE cells at the beginning of this spindle sequence, and the level of synchrony was lower than that for the middle phase of a sequence.
