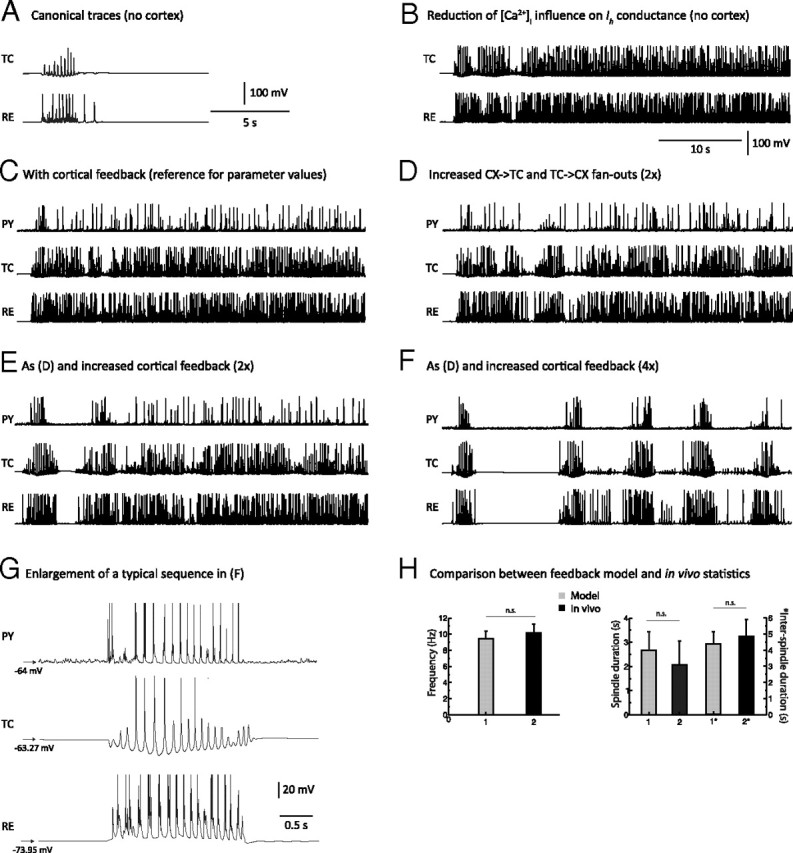
Figure 3.

Network mechanisms leading to spindle termination. A, Membrane potentials of TC and RE cells during a 10 s simulation of spindles generated in the thalamic model in absence of the cortex. One occurrence of a spindle sequence with waxing-and-waning properties was initiated by an external stimulation to the RE network. B, The [Ca2+]i influence on h-type current conductance (upregulation) was reduced by ∼55% compared to the value used in A, below the threshold that terminates spindles. The oscillation became continuous. C, The cortical network was added to the model used in B. The total synaptic strength of cortical feedback per cell was identical to the value used in Figure 2A and was sufficient to elicit synchronization of the network but unable to cause spindle termination in presence of a weak Ca2+ upregulation. D, Radii of the corticothalamic (PY→TC) and thalamocortical (TC→PY) afferent projections were doubled from the value used in C. Keeping Ca2+ upregulation low caused a few spontaneous spindle terminations to occur sporadically, but the duration of spindles remained excessively long. E, The total synaptic strength of cortical feedback per cell (PY→{TC,RE}) was doubled from the strength level used in C, while the radius of cortical afferents was the same as that in D. A few spindle epochs are apparent with evidence of a waxing-and-waning pattern (mostly at the beginning of the simulation). F, The total synaptic strength of cortical feedback per cell was quadrupled compared to the value used in C, while the radius of cortical afferents was kept constant from D. The waxing-and-waning envelope of the spindle has shape and duration comparable to the simulation in Figure 2. This demonstrates that a sufficiently strong cortical feedback coupled to a weak Ca2+ upregulation was sufficient for spindle termination and could control the duration of each spindle sequence. G, Membrane potential traces of PY, TC, and RE neurons during a typical waxing-and-waning spindle sequence obtained from a simulation using parameters as described for F. Compare this panel with in vivo data from Figure 1A. H, Statistical comparison of modeling and in vivo data: Left, frequency; right, average spindle sequence duration (1 and 2) and average inter-spindle interval duration (1* and 2*). All differences are statistically nonsignificant, showing that the modeling results agree well with in vivo data.
