Figure 6.

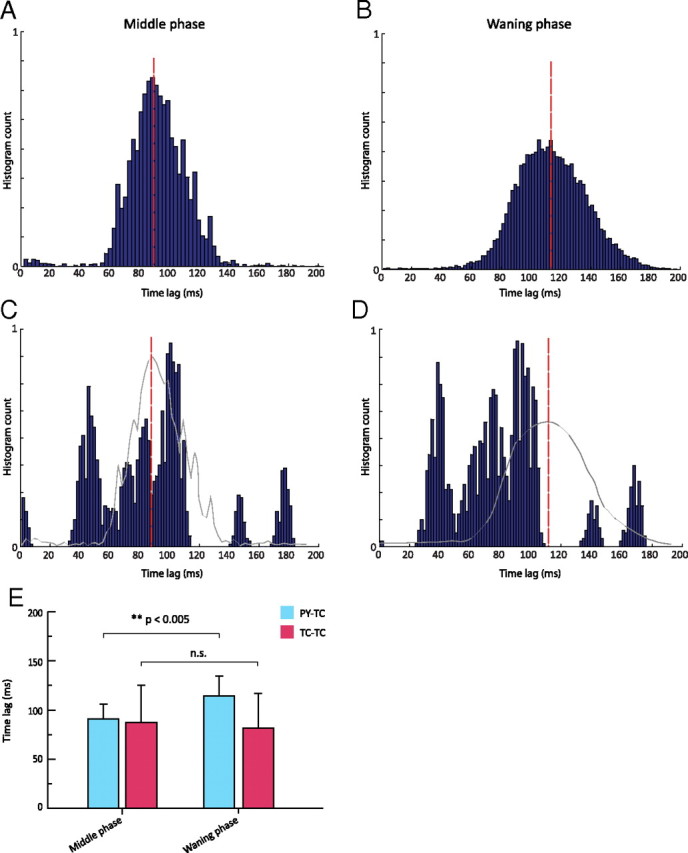
Firing distribution triggered by IPSP in model TC neurons. A, B, Time lag between TC and PY cells firing during the middle of a spindle (A) and during the waning phase (B). The envelope of the histogram in B has a lower amplitude and a wider distribution than that in A, suggesting great variance in the time lag differences between the IPSP before the TC burst and the onset of a spike in an afferent PY cell. The synchronization between cortical and thalamic cells during the middle of a spindle epoch is greater than during the waning phase. C, D, Time lag between TC cells during the middle of a spindle (C) and during the waning phase (D). The red bars show the mean values of the histogram in (A) and (B), respectively. The envelope of the histograms in A and B are superimposed in gray in C and D, respectively. E, Bar plot of mean time lag differences. There was a significant difference between the means for A (91.2 ± 14.8) and B (114.3 ± 20.2) (p < 0.005) (left), but there was no significant difference between the means for C (87.1 ± 38.2) and D (81.5 ± 35.3) (right).
