Fig. 2.

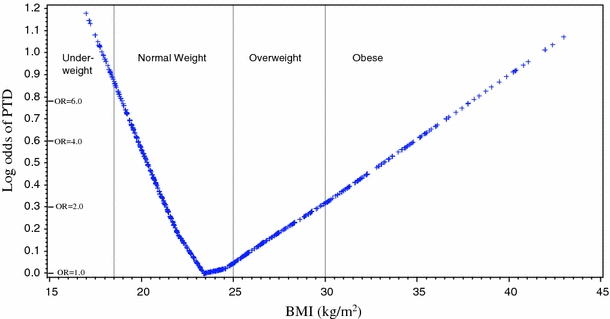
Loess plot of log odds of PTD as a function of prepregnancy BMI. Equivalent odds ratios are indicated on vertical axis. Vertical lines indicate borders of IOM BMI categories as labeled

Loess plot of log odds of PTD as a function of prepregnancy BMI. Equivalent odds ratios are indicated on vertical axis. Vertical lines indicate borders of IOM BMI categories as labeled