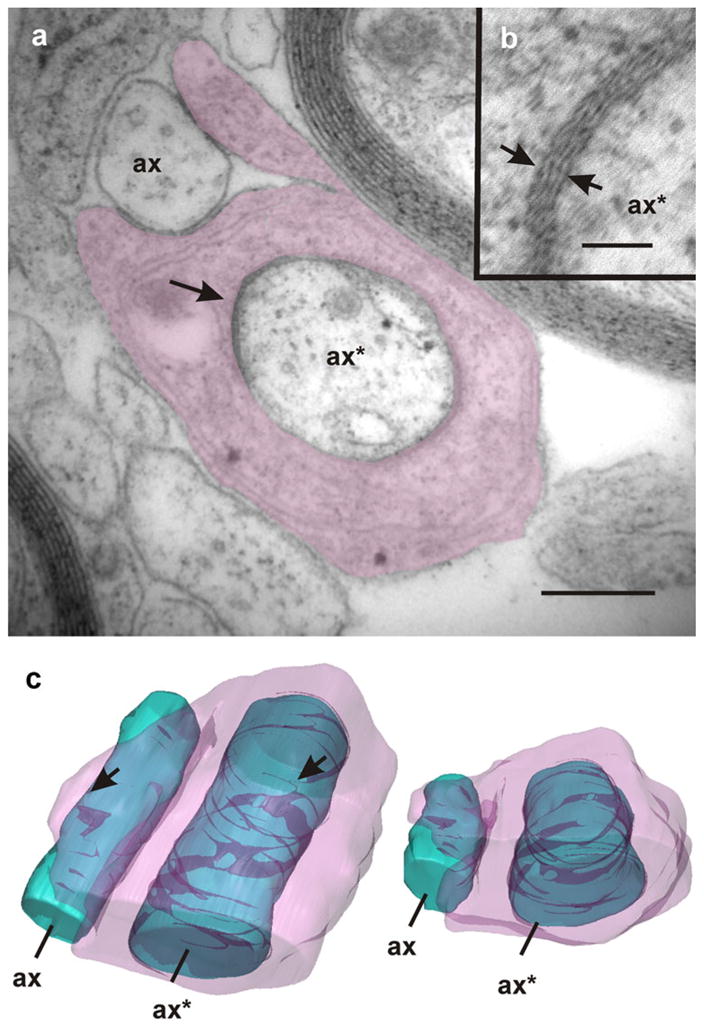
Fig. 10.

Ensheathing of regenerating axons. Intermixed with axons that appear partially ensheathed (ax) lie axons (ax*) that are completely enveloped by processes of glial cells (shaded). Note the presence of zones in which the periaxonal space is extremely reduced exhibiting an increased electron density (arrows in a, b). The TEM image corresponds to section number 12 of a continuous series comprising 17 sections. The accompanying 3D models (c frontal and dorsal views) reveal that these close junctions form discontinuous helical bands along the periaxonal space (arrowheads). Bars 1 μm (a), 80 nm (b)
