Fig. 9.
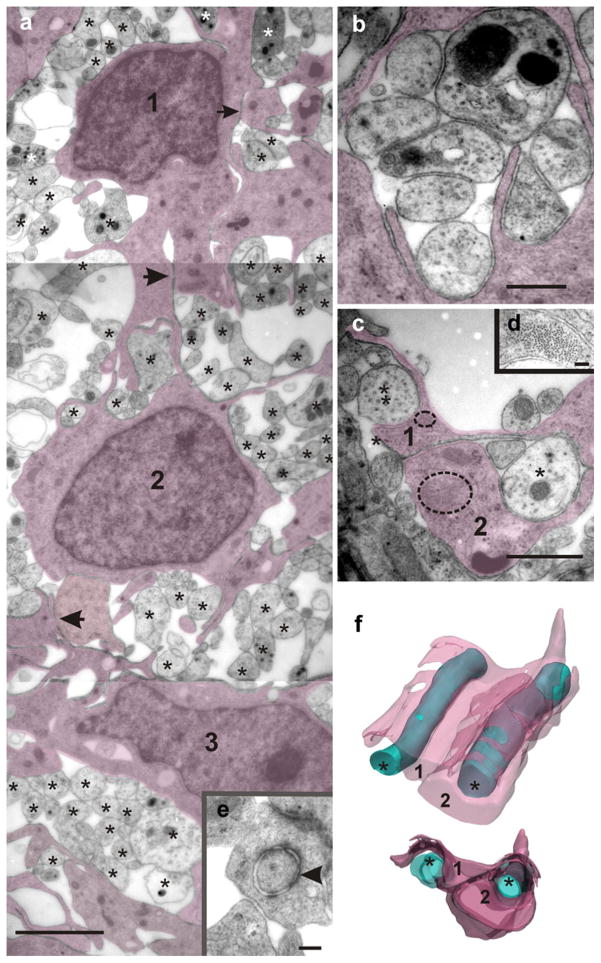
The bridge region is characterized by a loose embryonic-like cellular organization. a Panoramic TEM image showing three cells (1, 2, 3, shadowed) sending processes that partially cover numerous regenerating axons of uneven size (stars). Note the close intercellular contacts without visible membrane specializations (arrows). Desmosome-like contacts also occur in this region (see arrowhead in e). b Higher magnification electron micrograph showing a group of axons completely surrounded by glial processes (shadowed). c Two axons crossing the bridge (stars) were serially followed (25 serial sections) to explore their spatial relationships with adjacent glial processes (1, 2). Two bundles of gliofibrils have been encircled, one being shown at higher magnification in d. f The resulting three-dimensional (3D) models displayed from two different points of view reveal that the axon left in c is partially covered by a glial lamella (1), whereas the axon right in c is completely ensheated by glial lamellae 1 and 2. Bars 2 μm (a), 160 nm (e), 0.5 μm (b), 1 μm (c), 80 nm (d)

