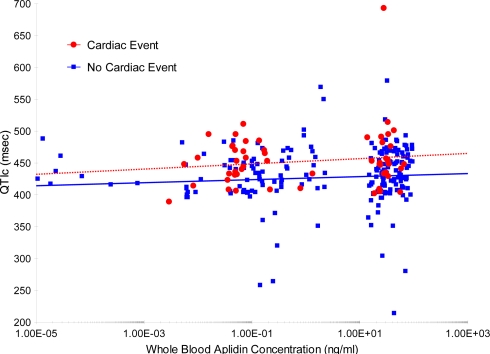
Figure 2.
Simulated whole blood plitidepsin concentration vs. Bazett’s corrected QT interval (QTc) interval (left graph) and heart rate (right graph) for patients without and with a cardiac event. The whole blood plitidepsin concentration at the ECG times was simulated taking the individual post-hoc PK parameters of population PK model and considering the real treatment history of each patient. Lines are the regression lines for patients without (blue line) and with a cardiac event (red line). ECG: electrocardiogram; PK: pharmacokinetic.

