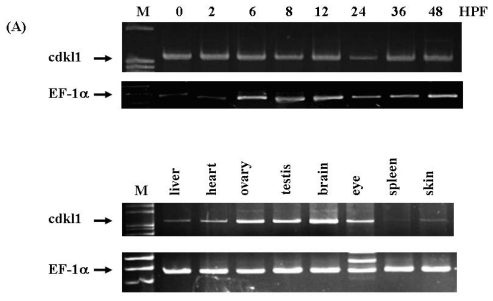
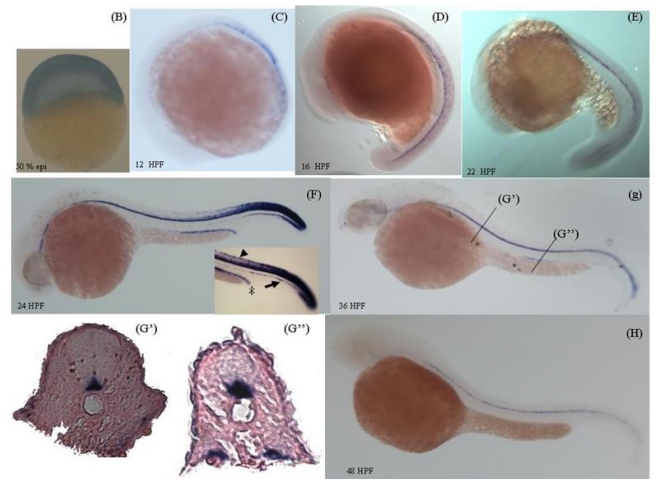
Figure 3.
Temporal and spatial expression of zcdkl1 gene. (A) Total RNA derived from different stages of development (upper panel) and adult tissues (lower panel) were converted into cDNA and subjected to PCR amplification. PCR fragments were separated by electrophoresis on 3% agarose gel and visualized by ethidium bromide staining. Elongation factor 1 α was included as internal control. (B–H) Expression of zcdkl1 was analyzed in whole mount in situ hybridization. The developmental stage is indicated in the lower left (G′ and G″), while the transverse section is indicated by line in panel (G). Sections were counterstained with eosin Y. (B–H) Lateral view with the anterior pole to the left. Insert in (F) represents the caudal region with higher magnification. The arrowhead indicates the dorsal neurons in the spinal cord. The arrow indicates the hypochord. The asterisk indicates the pronephric duct.


