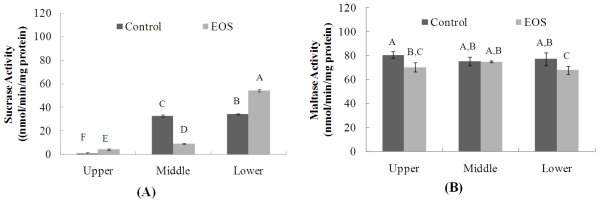
Figure 2.
Effects of EOS administration on sucrase (A) and maltase (B) activities (nmol/min/mg protein) in different parts of intestine. The results represent the mean ± S.D. of values obtained from three measurements. Bar with different letters indicate statistical significance of differences among groups at p < 0.05 by Duncan’s test.

