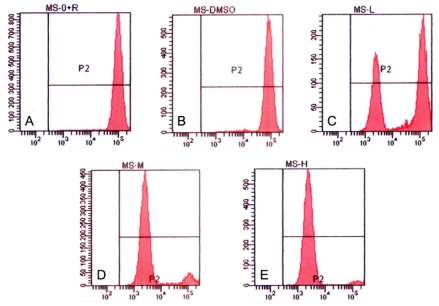
Figure 7.
Induction of K562 cell mitochondrial membrane collapse in the presence of tryptanthrin. Mitochondrial membrane potential was assessed by FCM after Rhodamine 123 staining. Rhodamine 123 enriched mainly in mitochondria showing red fluorescence reflecting changes of mitochondrial membrane potential. Cells were treated with no tryptanthrin (A), 0.5% DMSO (B) and 6.25, 12.5 and 25μg/mL tryptanthrin, respectively (C, D and E).

