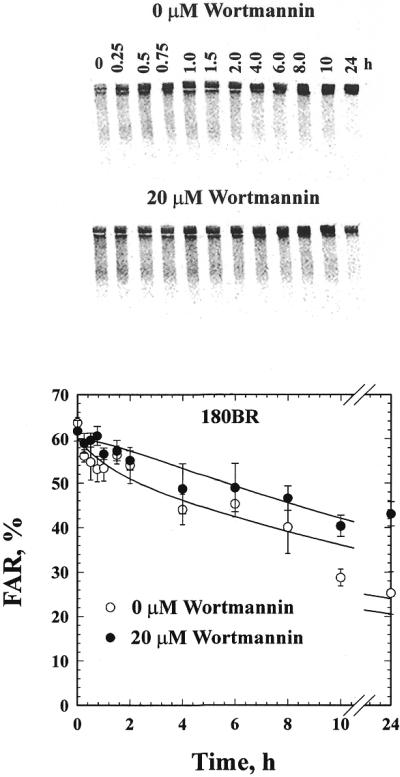
Figure 1.

Rejoining of IR-induced DNA DSBs in 180BR primary fibroblasts in the presence or absence of 20 µM wortmannin. The upper panel shows a typical gel, while the lower panel shows the quantitative analysis from three independent experiments. Plotted are the mean and the standard error. The lines through the data points represent fitting to the sum of two exponential functions as described in Materials and Methods. The value of FAR measured in non-irradiated cells has been subtracted from all data points.
