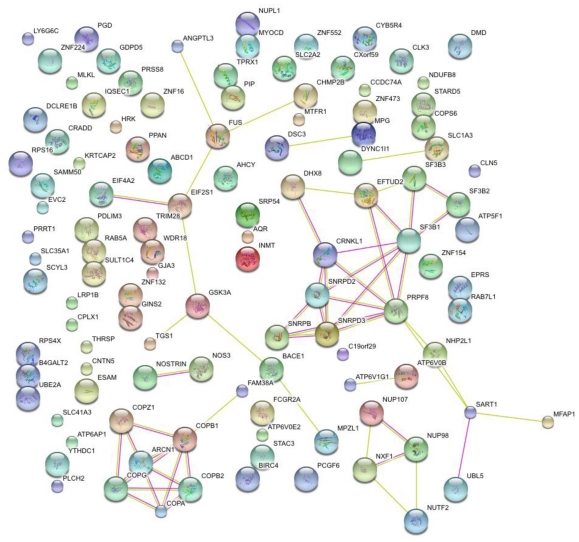
Figure 2.
Network Association Map of RNAi screening results generated by the Brass et al. influenza virus infection. The list of perturbed host cell genes were complied in STRING and illustrated as nodes above. Lines between different nodes (edges) represent protein interactions that are either known experimentally (purple) or predicted computationally (yellow). Significant nodes such as those shown around COPA and CRNLK1 suggest these pathways to be critical for the viral life cycle.

