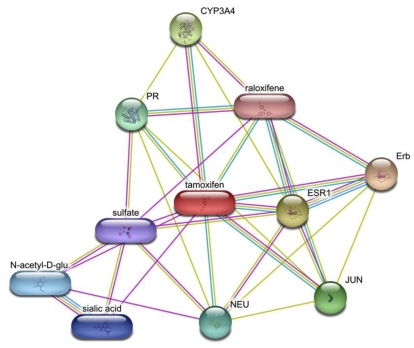
Figure 3.
Gene interaction map overlapped with Tamoxifen via the STITCH database. The latter also connects ovals to one another suggesting that these molecules display similar biological behavior towards the same target. Edges refer to interactions as determined by experiment (purple), manual curation (cyan) or computationally predictions (yellow).

