
Table 4.
Correlation Coefficient of Linear Regression Between Each of the ITS Measurements of the HR-pQCT Images of Trabecular Bone at Both the Distal Radius and the Distal Tibia
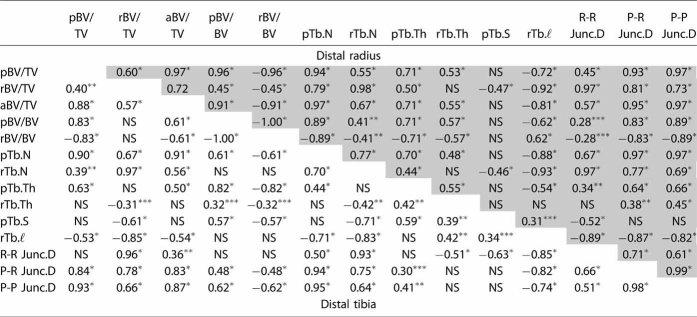 |
Note: Data were combined from both control and IOP groups. Data for the distal radius are highlighted in light gray.
*p < .001; **p < .01; ***p < .05. NS: p > .05. Please refer to the Glossary for definitions of each ITS-based parameter.