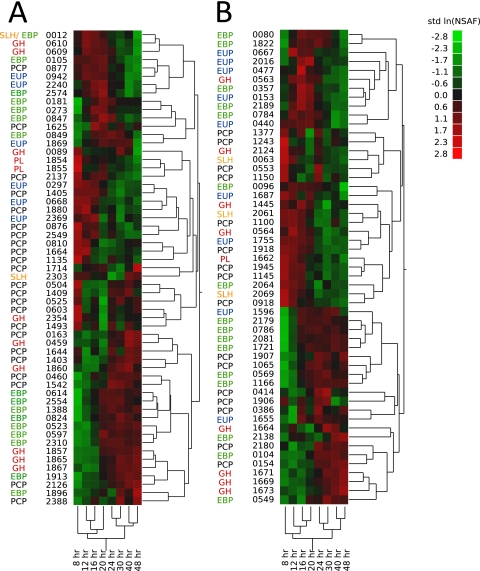
Fig. 2.
Heat maps showing proteins whose abundances changed significantly in the cell-free culture supernatant. Sets of LC-MS/MS data were acquired in duplicate for C. bescii (A) and C. obsidiansis (B) from 8 to 48 h. Peptides were identified using SEQUEST, and NSAF values for each protein were ln transformed and standardized for one-way ANOVA. Abundances at each time point range from low (green) to high (red). Gene loci are listed without the prefix Athe_ for C. bescii or the prefix COB47_ for C. obsidiansis. Proteins are annotated as EBPs (green), EUP (extracellular unknown proteins; blue), GHs (the CAZy term for glycosidases; red), PCPs (black), PL (pectate lyases; red), or SLH (proteins with SLH domains; orange).

