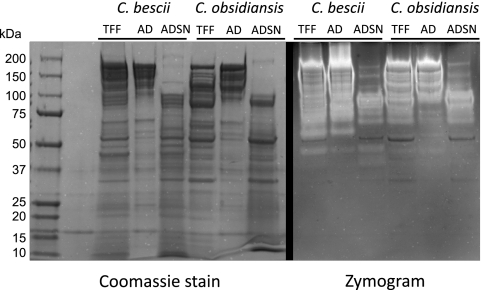
Fig. 6.
SDS-PAGE analysis and zymogram of cellulase enrichment fractions. Protein samples from the C. bescii and C. obsidiansis cellulase enrichments analyzed in Table 2 were separated on two 4 to 20% gradient gels together with a gradient protein ladder of 10 to 250 kDa. One gel was stained with Coomassie brilliant blue dye to visualize all of the proteins (left). The other gel was incubated in a CMC solution and subsequently stained with Congo Red dye (right). Unstained areas indicate CMCase activity. In both organisms, high-molecular-weight proteins from TFF were concentrated in AD and depleted in ADSN, except for an ∼90-kDa component. The total protein and activity patterns of the two organisms are similar, with the exception of an ∼60-kDa activity band that is unique to C. bescii.

