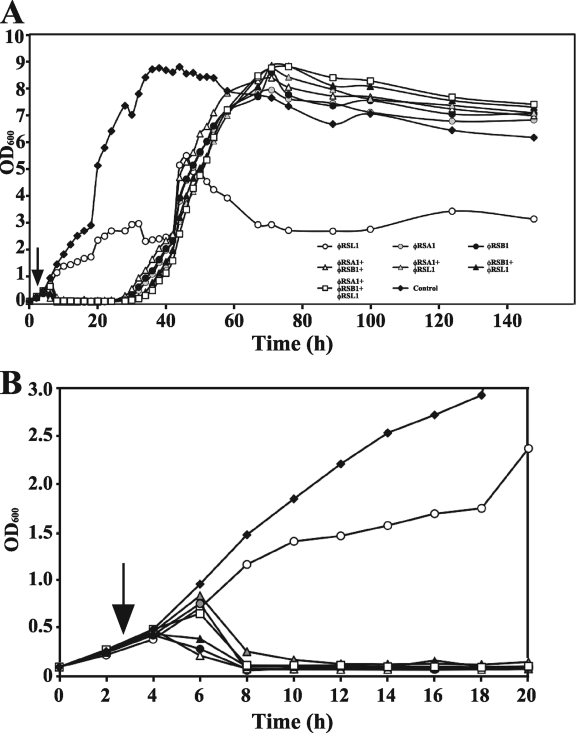
Fig. 1.
Time course of bacterial growth after infection with bacteriophages. The first 20 h region is enlarged in panel B (the symbols are the same as shown in panel A). Cells of R. solanacearum strain M4S (OD600 = 0.3 corresponding to ∼108 cells/ml; vertical arrow) were infected solely or by mixing with three phages: φRSA1, dose = 0.5 × 10⁸ PFU/ml; φRSB1, dose = 0.5 × 10⁸ PFU/ml; and φRSL1, dose = 5.0 × 10⁸ PFU/ml. At about 30 h p.i., resistant cells started to grow when treated with φRSA1 and/or φRSB1, either alone or as part of a phage mixture. Cells solely infected with φRSL1 were kept at a low cell density. Similar results were obtained with different R. solanacearum strains (data not shown).

