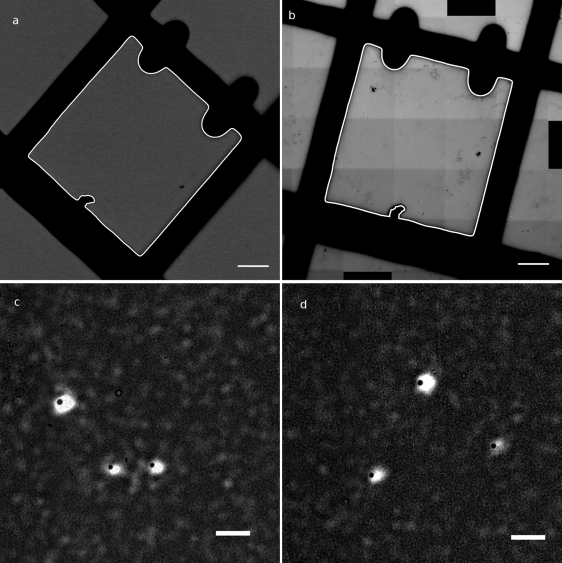
Fig. 1.
Superimposition of fluorescence and TEM images on test beads. (a) Transmitted light image of the square of interest, with automatically extracted square in white (bar, 20 μm). (b) Reconstructed mosaic TEM image of the square of interest, with automatically extracted square in white (bar, 20 μm). (c and d) Overlay of observed beads in fluorescence (white spots) after registration and in TEM (black dots) (bar, 2 μm).

