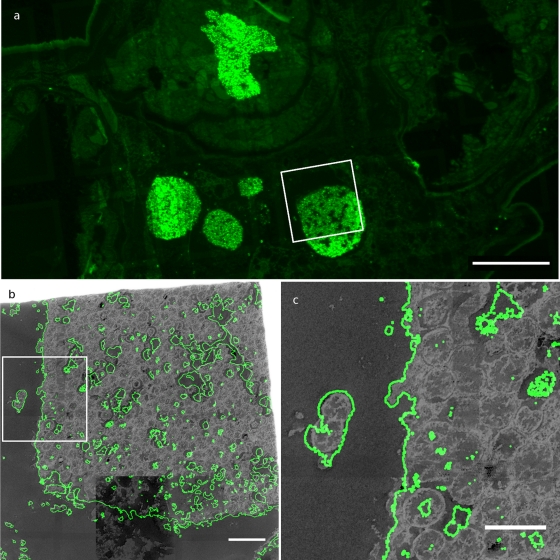
Fig. 2.
FISH-CLEM imaging on aphid tissues. (a) Mosaic image of fluorescent signals in aphid tissues (bar, 100 μm). (b) Superimposition using the procedure illustrated in Fig. 1, of fluorescent signal (in green, contours shown) and TEM signal (in gray) (bar, 10 μm). (c) Zoom on an isolated bacterium showing very good superimposition of fluorescence and TEM signals (bar, 5 μm).

