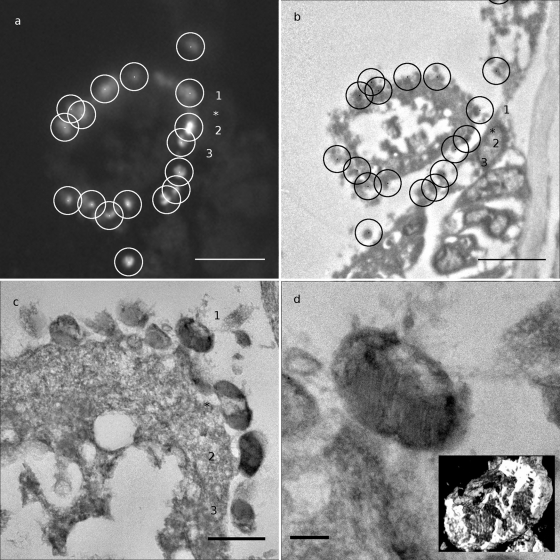
Fig. 4.
Superimposition of FISH and TEM information for detection of bacteria. (a) Higher magnification of the framed area from Fig. 3a. White dots and circled areas correspond to selected bacteria (radius, 1 μm; bar, 5 μm). (b) Higher magnification of the framed area from Fig. 3b. Circles are centered on positions computed from positions in panel a) (radius, 1 μm). Note that bacteria detected in this TEM image are inside circles (bar, 5 μm). (c) Zoom image at higher resolution (mosaic image). Note the extracellular localization of bacteria. Numbers refer to bacteria detected in panels a and b. Note that a bacterium (*) was not detected by fluorescence (bar, 1 μm). (d) Enlarged view of the bacterium 1 displaying stacked internal membranes typical of type I methanotrophic Gammaproteobacteria (bar, 200 nm). The inset shows 3D visualization of the reconstructed bacterium from tomogram (see the supplemental material).

