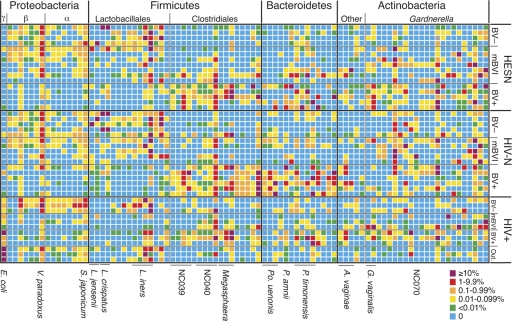
Fig. 3.
Heat map of deep-sequencing OTUs detected in at least 25% of the total study group members, organized in rows by HIV serostatus and BV status. OTUs are organized into columns by higher-order phylotype. The scale indicates the percentage of the total reads for each individual. Selected OTUs referred to in text are indicated at the bottom. A full listing of the OTUs, along with abundance information and statistical comparisons by HESN or HIV+ status and BV status are provided in Tables S4 and S5 in the supplemental material.

