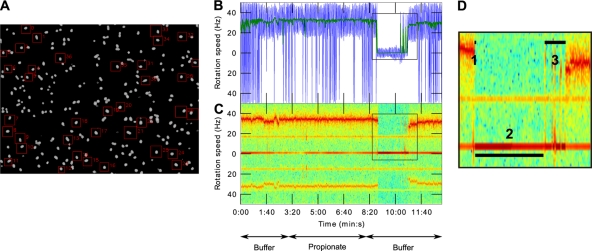
Fig. 1.
Single-cell level chemosensory response analysis using the improved computer tracking of tethered rotating cells. (A) Video frame of a microscope field of view (×40 magnification) of tethered bacteria whose motions are to be analyzed using BRAS. The regions used for motion analyses are delimited by red squares. (B and C) “Click & mean”-generated graphical representations of a single-cell rotation speed over time. Arrows indicate the solution in the microscope chamber. (B) Instantaneous speed measurements. Colors: blue, raw 100-Hz signal; green, moving average of the same signal using a Gaussian window of 1 s. (C) Frequency domain analysis of bacterial motion used to extract rotation speeds. The black squares highlight a chemosensory response to propionate removal. (D) Enlargement of the chemosensory response represented in panel C. The numbers show the different phases of a chemosensory response which can be measured using a “click & mean” interactive interface. Numbered segments: 1, duration of the stopping phase; 2, duration of the stopped phase; 3, duration of the recovery phase. The total chemosensory response duration equals 1+2+3.

